I am a big fan of the PeopleSoft Performance Monitor, but the more often I use it I discover it has a few rough edges. Some of the analytics components do not perform well when their is either a large amount of data in the PSPMTRANSHIST table, or when there are a lot of agents in a system. So I have used the Performance Monitor to trace the Performance Monitor
components.
You have to configure it to self-monitor, ignoring all the warning messages.
components.
You have to configure it to self-monitor, ignoring all the warning messages.

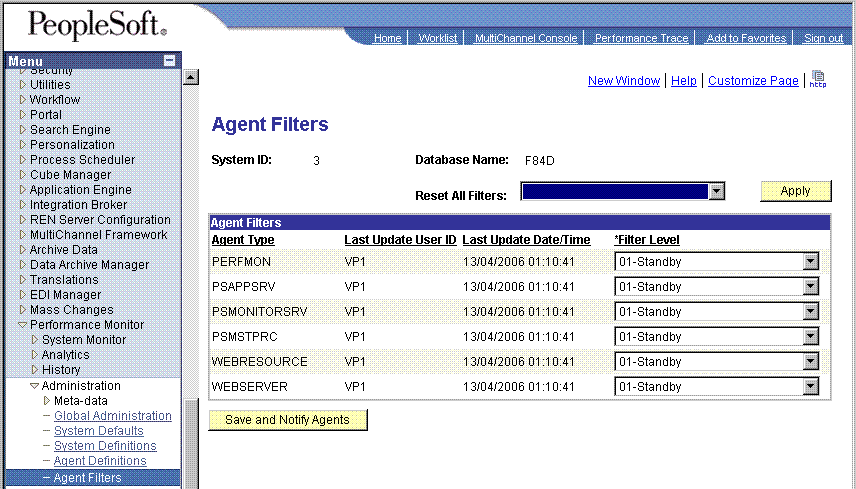
But, you are not interested in the sampled statistics on this database, so disable monitoring by setting the filter level on all agents to standby.
 Instead enable Performance Trace with either Verbose or Debug
 The component trace indicates which analytic queries take the most time.
I have changed and added the following indexes to the performance tables.
CREATE INDEX PSDPSPMEVENTHIST ON PSPMEVENTHIST
(PM_EVENT_DEFN_SET, PM_EVENT_DEFN_ID, PM_AGENTID, PM_AGENT_DTTM)
TABLESPACE PSINDEX ... PCTFREE 1 COMPRESS 3
/
CREATE INDEX PSCPSPMTRANSHIST ON PSPMTRANSHIST
(
PM_TRANS_DEFN_SET,PM_TRANS_DEFN_ID, PM_PERF_TRACE,PM_METRIC_VALUE7
/*,PM_MON_STRT_DTTM */
) TABLESPACE PSINDEX ... PCTFREE 1 COMPRESS 4
/
CREATE INDEX PSDPSPMTRANSHIST ON PSPMTRANSHIST
(PM_TOP_INST_ID, PM_TRANS_DEFN_SET, PM_TRANS_DEFN_ID)
TABLESPACE PSINDEX ... PCTFREE 1
COMPRESS 3
/
The Performance Monitor tables (PSPMTRANSHIST, PSPMTRANSARCH, PSPMEVENTHIST, PSPMEVENTARCH) are never updated. The performance collator application server process (PSPPMSRV) inserts data into the performance monitor tables, and later the performance monitor archive Appliction Engine process (PSPM_ARCHIVE) will insert them into the %ARCH tables, and delete them from the %HIST tables. Therefore, it is sensible to pack the data by minimising free space in these tables, and so reduce both logical and phyiscal I/O. So
I have reduced the free space in the data blocks (PCTFREE) to 0% on tables and indexes, and increased PCTUSED to 99%.
I have also found it beneficial to collect histograms on certain columns
BEGIN
sys.dbms_stats.gather_table_Stats
(ownname => 'SYSADM'
,tabname => 'PSPMTRANSHIST'
,estimate_percent => DBMS_STATS.AUTO_SAMPLE_SIZE
,method_opt => 'FOR COLUMNS PM_PERF_TRACE, PM_TRANS_DEFN_ID,
pm_metric_value7'
,cascade => TRUE
);
END;
/
If you have performance problems with Performance Monitor, remember that you can also use Performance Monitor to analyse its own analytics.


 @go-faster.co.uk on BlueSky


9 comments :
Sir ,
i was trying to configure the performance monitor.
I am new to peoplesoft.
I performed all the steps as provided in the peoplebook.
But when ever i try to access system monitor link it says no systems assosiated.
Can you help me please.
Thnaks in advance.
There are a number of helpful notes on Customer Connection concerning the Performance Monitor.
GSC Solution 200958904: E-PerfMon:Troubleshooting checklist and information to provide GSC .
GSC Solution 201004591 - E-PerfMon: Web Server Agent Definitions not appearing nor listed in System Performance page on Performance Monitoring System.
GSC Solution 200986583 -E-Webserver: Weblogic 8.1 pia log fills up with the Performance Monitor info messages. How to stop these messages from being logged?
GSC Solution 200985934 -E-PerfMon:System Performance page is not picking up Application server except for Scheduler and Web Server domains.
GSC Solution 200951814 - E-PerfMon: How to enable the Monitor Console in the Web profile?
GSC Solution 200775005: Performance Monitor -How to get rid of "Stale Agent Data Detected" message from System Performance page?
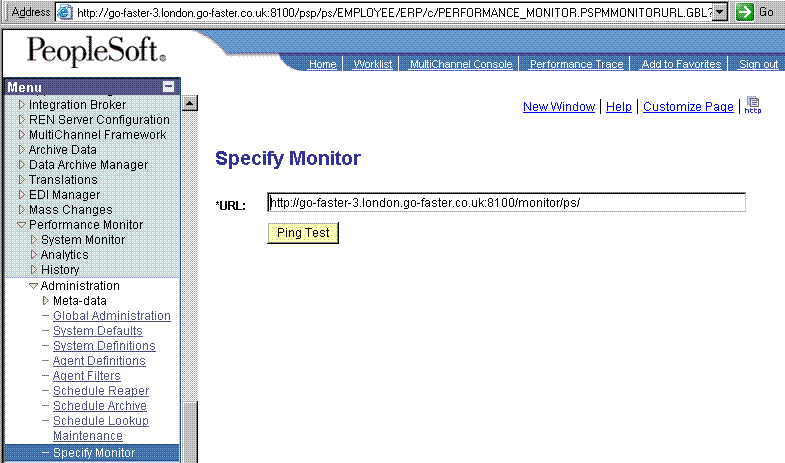
Sometimes, when you have entered the URL of the monitor into the monitored system, it is necessary to restart the monitored system and then do something to cause it to register with the monitor.
I have also found it beneficial to create the following function-based index on PSPMTRANSHIST to support searches for Performance Traces in the analytic components.
CREATE INDEX PSZPSPMTRANSHIST ON PSPMTRANSHIST (UPPER(PM_PERF_TRACE))
TABLESPACE PSINDEX ... PCTFREE 0 COMPRESS 1
/
hello,
a little small question..
can you provide me this document?GSC Solution 200775005: Performance Monitor -How to get rid of "Stale Agent Data Detected" message from System Performance page? or any solution about the error Stale Agent Data Detected? many thanks
Hi David,
I've created a new perfmon database and application about 2 hours ago and I'm monitoring 11 application servers and 3 web servers . THe PSPMTRANSHIST is growing verrrrry fast.
The result of "select count(1) from pssys.PSPMTRANSHIST" gives 506111.
Please give me an advise about what to do with such an amount of dat and what causes the table to grow so fast.
Regards,
The PSPMTRANSHIST and PSPMEVENTHIST tables can become large.
You need to think about the sampling frequency and the archiving policy. Depending on the size of the system it would be reasonable to sample anything from 1:50 transactions to 1:1000 transaction. The more you sample the more rows you get. The agent filter level should be set to standard. Verbose collects lots of extra information about SQL, but it does come at a price: additional runtime overhead, and addition monitoring data to store. These numbers are just very rough indications of what I think is reasonable. Similarly with events, you need to consider how frequently to collect them. However, I find it helpful to have them collected fairly frequently. Every 5 to 10 minutes. Your mileage will vary.
As these tables grow, so the performance of the PeopleSoft delivered analytic components degrades. I usually choose to archive/delete data after 7. If you archive the data it gets transferred to the PSPMTRANSARCH and PSPMEVENTARCH tables. There is nothing delivered to manage these tables. Also, the data is no longer visible via any of the delivered analytic components. Instead you need to develop your own queries.
I tend to prefer using separate monitoring systems for production and pre-production. I would not bother to regularly sample at all in pre-production systems, instead PPM is there to permit performance traces to be collected. One possible exception is a performance test system where you are using an on-line load test tool such as LoadRunner to simulate a user load.
Hi David,
I have configured PPM recently and your blog has been of great help in understanding the concepts of PPM. My question today is, is there a way to schedule the Performance Monitoring for a production database or do we have to continously monitor it manually.
PPM can be configured to sample on a regular basis. You can control the proportion of transactions that are logged, and the frequency with which instantaneous metrics (events) are collected. Beyond that monitoring is either on or off. You can't specify a time window during which monitoring is on.
There is no functionality in PPM to set thresholds, not to trigger alerts when those thresholds are exceeded. That is something that you could customise into your PPM system.
Hello David,
I have a question, have a requirement to re enable the performance monitor. the last time it was used was back in 2004 or 2005 ( i was not there when this was being done). Its a production monitoring system which means they have seperate web, app and database servers. the problem now is that no one knows the database where the monitor is storing the data. peoplebooks does not shed light on it. there is no documentation about the setup also.
any ideas from you?
Post a Comment