Showing posts with label Performance Monitor. Show all posts
Showing posts with label Performance Monitor. Show all posts
Wednesday, May 08, 2019
PeopleSoft Administrator Podcast: #183 – Effective Performance Monitoring
I recently recorded a podcast with Dan Iverson and Kyle Benson for the PeopleSoft Administrator Podcast, this time about instrumentation, monitoring the performance of PeopleSoft system, and Performance Monitor. There is also just a little about cursor sharing.


Friday, September 04, 2015
Measuring Tuxedo Queuing in the PeopleSoft Application Server
Why Should I Care About Queuing?
Queuing in the application server is usually an indicator of a performance problem, rather than a problem in its own right. Requests will back up on the inbound queue because the application server cannot process them as fast as they arrive. This is usually seen on the APPQ which is serviced by the PSAPPSRV process, but applies to other server processes too. Common causes include (but are not limited to):- Poor performance of either SQL on the database or PeopleCode executed within the application server is extending service duration
- The application server domain is undersized for the load. Increasing the number of application server domains or application server process may be appropriate. However, before increasing the number of server process it is necessary to ensure that the physical server has sufficient memory and CPU to support the domain (if the application server CPU is overloaded then requests move from the Tuxedo queues to the operating system run queue).
- The application server has too many server processes per queue causing contention in the systems calls that enqueue and dequeue requests to and from IPC queue structure. A queue with more than 8-10 application server processes can exhibit this contention. There will be a queue of inbound requests, but not all the server processes will be non-idle.
What you do about queuing depends on the circumstances, but it is something that you do want to know about.
3 Ways to Measure Application Server Queuing
There are several ways to detect queuing in Tuxedo- Direct measurement of the Tuxedo domain using the tmadmin command-line interface. A long time ago I wrote a shell script tuxmon.sh. It periodically runs the printqueue and printserver commands on an application server and extracts comma separated data to a flat that can then be loaded into a database. It would have to be configured for each domain in a system.
- Direct Measurement with PeopleSoft Performance Monitor (PPM). Events 301 and 302 simulate the printqueue and printserver commands. However, event 301 only works from PT8.54 (and at the time of writing I am working on a PT8.53 system). Even then, the measurements would only be taken once per event cycle, which defaults to every 5 minutes. I wouldn't recommend increasing the sample frequency, so this will only ever be quite a coarse measurement.
- Indirect Measurement from sampled PPM transactions. Although includes time spent on the return queue and to unpack the Tuxedo message. This technique is what the rest of this article is about.
Indirectly Measuring Application Server Queuing from Transactional Data
Every PIA and Portal request includes a Jolt call made by the PeopleSoft servlet to the domain. The Jolt call is instrumented in PPM as transaction 115. Various layers in the application server are instrumented in PPM, and the highest point is transaction 400 which where the service enters the PeopleSoft application server code. Transaction 400 is always the immediate child of transaction 115. The difference in the duration of these transactions is the duration of the following operations:- Transmit the message across the network from the web server to the JSH. There is a persistent TCP socket connection.
- To enqueue the message on the APPQ queue (including writing the message to disk if it cannot fit on the queue).
- Time spent in the queue
- To dequeue the message from the queue (including reading the message back from disk it was written there).
- To unpack the Tuxedo message and pass the information to the service function
- And then repeat the process for the return message back to the web server via the JSH queue (which is not shown in tmadmin)
Some simple arithmetic can convert this duration into an average queue length. A queue length of n means that n requests are waiting in the queue. Each second there are n seconds of queue time. So the number of seconds per second of queue time is the same as the queue length.
I can take all the sampled transactions in a given time period and aggregate the time spent between transactions 115 and 400. I must multiply it by the sampling ratio, and then divide it by the duration of the time period for which I am aggregating it. That gives me the average queue length for that period.
This query aggregates queue time across all application server domains in each system. It would be easy to examine a specific application server, web server or time period.
REM https://blog.psftdba.com/2015/09/measuring-tuxedo-queuing-in-peoplesoft.html
WITH c AS (
SELECT B.DBNAME, b.pm_sampling_rate
,      TRUNC(c115.pm_agent_Strt_dttm,'mi') pm_agent_dttm
,      A115.PM_DOMAIN_NAME web_domain_name
,      SUBSTR(A400.PM_HOST_PORT,1,INSTR(A400.PM_HOST_PORT,':')-1) PM_tux_HOST
,      SUBSTR(A400.PM_HOST_PORT,INSTR(A400.PM_HOST_PORT,':')+1) PM_tux_PORT
,      A400.PM_DOMAIN_NAME tux_domain_name
,      (C115.pm_trans_duration-C400.pm_trans_duration)/1000 qtime
FROM   PSPMAGENT A115 /*Web server details*/
,      PSPMAGENT A400 /*Application server details*/
,      PSPMSYSDEFN B
,      PSPMTRANSHIST C115 /*Jolt transaction*/
,      PSPMTRANSHIST C400 /*Tuxedo transaction*/
WHERE  A115.PM_SYSTEMID = B.PM_SYSTEMID
AND    A115.PM_AGENT_INACTIVE = 'N'
AND    C115.PM_AGENTID = A115.PM_AGENTID
AND    C115.PM_TRANS_DEFN_SET=1
AND    C115.PM_TRANS_DEFN_ID=115
AND    C115.pm_trans_status = '1' /*valid transaction only*/
--
AND    A400.PM_SYSTEMID = B.PM_SYSTEMID
AND    A400.PM_AGENT_INACTIVE = 'N'
AND    C400.PM_AGENTID = A400.PM_AGENTID
AND    C400.PM_TRANS_DEFN_SET=1
AND    C400.PM_TRANS_DEFN_ID=400
AND    C400.pm_trans_status = '1' /*valid transaction only*/
--
AND    C115.PM_INSTANCE_ID = C400.PM_PARENT_INST_ID /*parent-child relationship*/
AND    C115.pm_trans_duration >= C400.pm_trans_duration
), x as (
SELECT dbname, pm_agent_dttm
,      AVG(qtime) avg_qtime
,      MAX(qtime) max_qtime
,      c.pm_sampling_rate*sum(qtime)/60 avg_qlen
,      c.pm_sampling_rate*count(*) num_services
FROM   c
GROUP BY dbname, pm_agent_dttm, pm_sampling_rate
)
SELECT * FROM x
ORDER BY dbname, pm_agent_dttm
- Transactions are aggregated per minute, so the queue time is divided by 60 at the end of the calculation because we are measuring time in seconds.

Is this calculation and assumption reasonable?
The best way to validate this approach would be to measure queuing directly using tmadmin. I could also try this on a PT8.54 system where event 301 will report the queuing. This will have to wait for a future opportunity.However, I can compare queuing with the number of busy application servers at reported by PPM event 302 for the CRM database. Around 16:28 queuing all but disappears. We can see that there were a few idle application servers which is consistent with the queue being cleared. Later the queuing comes back, and most of the application servers are busy again. So it looks reasonable.

Tuesday, March 10, 2015
PeopleTools 8.54: Performance Performance Monitor Enhancements
This is part of a series of articles about new features and differences in PeopleTools 8.54 that will be of interest to the Oracle DBA.
 This is a useful enhancement when searching for a specific or a small number of transaction. However, I do not think it will save you from having to query the underlying transactions table.
Now, the archive process now works hour by hour, and this will use the index on the timestamp column.

Transaction History Search Component
There are a number of changes:- You can specify multiple system identifiers. For example, you might be monitoring Portal, HR and CRM. Now you can search across all of them in a single search.
- It has always been the case that when you drill into the Performance Monitoring Unit (PMU), by clicking on the tree icon, you would see the whole of a PMU that invoked services from different systems.
- You can also specify multiple transaction types, rather than have to search each transaction type individually.

PPM Archive Process
The PPM archive process (PSPM_ARCHIVE) has been significantly rewritten in PeopleTools 8.54. In many places, it still uses this expression to identify rows to be archived or purged:%DateTimeDiff(X.PM_MON_STRT_DTTM, %CurrentDateTimeIn) >= (PM_MAX_HIST_AGE * 24 * 60)
ROUND((CAST(( CAST(SYSTIMESTAMP AS TIMESTAMP)) AS DATE) - CAST((X.PM_MON_STRT_DTTM) AS DATE)) * 1440, 0)
   >= (PM_MAX_HIST_AGE * 24 *  60)
Now, the archive process now works hour by hour, and this will use the index on the timestamp column.
"… AND X.PM_MON_STRT_DTTM <= SYSDATE - PM_MAX_HIST_AGE
and (PM_MON_STRT_DTTM) >= %Datetimein('" | DateTimeValue(&StTime) | "')
and (PM_MON_STRT_DTTM) <= %DateTimeIn('" | DateTimeValue(&EndTime) | "')"
Tuxedo Queuing
Since Performance Monitor was first introduced, event 301 has never reported the length of the inbound message queues in Tuxedo. The reported queue length was always zero. This may have been fixed in PeopleTools 8.53, but I have only just noticed itJava Management Extensions (JMX) Support
There have been some additions to Performance Monitor that suggest that it will be possible to extract performance metrics using JMX. The implication is that the Oracle Enterprise Manager Application Management Pack of PeopleSoft will be able to do this. However, so far I haven't found any documentation. The new component is not mentioned in the PeopleTools 8.54: Performance Monitor documentation.- New Table
- PS_PTPMJMXUSER - keyed on PM_AGENTID
- New Columns
- PSPMSYSDEFAULTS - PTPHONYKEY. So far I have only seen it set to 0.
- PSPMAGENT - PM_JMX_RMI_PORT. So far only seen it set to 1
- New Component

Monday, November 03, 2014
Filtering PeopleTools SQL from Performance Monitor Traces
I have been doing some on-line performance tuning on a PeopleSoft Financials system using PeopleSoft Performance Monitor (PPM). End-users have collect verbose PPM traces. Usually, when I use PPM in a production system, all the components are fully cached by the normal activity of the user (except when the application server caches have recently been cleared). However, when working in a user test environment it is common to find that the components are not fully cached. This presents two problems.
- The application servers spend quite a lot of time executing queries on the PeopleTools tables to load the components, pages and PeopleCode into their caches. We can see in the screenshot of the component trace that there is a warning message that component objects are not fully cached, and that these cache misses skew timings.
- In verbose mode, the PPM traces collect a lot of additional transactions capturing executions and fetches against PeopleTools tables. The PPM analytic components cannot always manage the resultant volume of transactions.
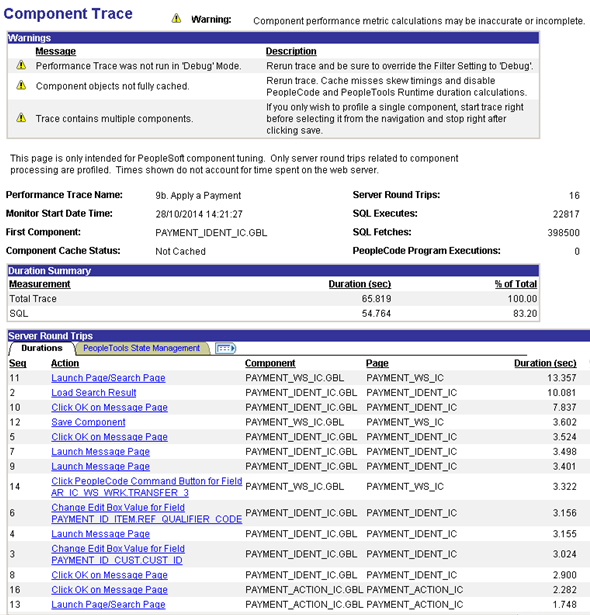 |
| Figure 1. Component trace as collected by PPM |
 |
| Figure 2. SQL Summary of PPM trace with PeopleTools SQL |
 |
| Figure 3: Details of longest PMU with PeopleTools SQL |
Another consequence of the PeopleTools data is that it can take a long time to open the PMU tree. There is no screenshot of the PMU tree here because in this case I had so much data that I couldn't open it before the transaction timed out!
Solution
My solution to this problem is to delete the transactions that relate to PeopleTools SQL and correct the durations, and the number of executions and fetches held in summary transactions. The rationale is that these transactions would not normally occur in significant quantities in a real production system, and there is not much I can do about them when they do.The first step is to clone the trace. I could work on the trace directly, but I want to preserve the original data.
PPM transactions are held in the table PSPMTRANSHIST. They have a unique identifier PM_INSTANCE_ID. A single server round trip, also called a Performance Monitoring Unit (PMU), will consist of many transactions. They can be shown as a tree and each transaction has another field PM_PARENT_INST_ID which holds the instance of the parent. This links the data together and we can use hierarchical queries in Oracle SQL to walk the tree. Another field PM_TOP_INST_ID identifies the root transaction in the tree.
Cloning a PPM trace is simply a matter of inserting data into PSPMTRANSHIST. However, when I clone a PPM trace I have to make sure that the instance numbers are distinct but still link correctly. In my system I can take a very simple approach. All the instance numbers actually collected by PPM are greater than 1016. So, I will simply use the modulus function to consistently alter the instances to be different. This approach may break down in future, but it will do for now.
On an Oracle database, PL/SQL is a simple and effective way to write simple procedural processes. I have written two anonymous blocks of code.
Note that the cloned trace will be purged from PPM like any other data by the delivered PPM archive process.
REM xPT.sql
BEGIN --duplicate PPM traces
  FOR i IN (
    SELECT h.*
    FROM   pspmtranshist h
    WHERE  pm_perf_trace != ' ' /*rows must have a trace name*/
--  AND    pm_perf_trace = '9b. XXXXXXXXXX' /*I could specify a specific trace by name*/
    AND    pm_instance_id > 1E16 /*only look at instance > 1e16 so I do not clone cloned traces*/
  ) LOOP
    INSERT INTO pspmtranshist
    (PM_INSTANCE_ID, PM_TRANS_DEFN_SET, PM_TRANS_DEFN_ID, PM_AGENTID, PM_TRANS_STATUS,
    OPRID, PM_PERF_TRACE, PM_CONTEXT_VALUE1, PM_CONTEXT_VALUE2, PM_CONTEXT_VALUE3,
    PM_CONTEXTID_1, PM_CONTEXTID_2, PM_CONTEXTID_3, PM_PROCESS_ID, PM_AGENT_STRT_DTTM,
    PM_MON_STRT_DTTM, PM_TRANS_DURATION, PM_PARENT_INST_ID, PM_TOP_INST_ID, PM_METRIC_VALUE1,
    PM_METRIC_VALUE2, PM_METRIC_VALUE3, PM_METRIC_VALUE4, PM_METRIC_VALUE5, PM_METRIC_VALUE6,
    PM_METRIC_VALUE7, PM_ADDTNL_DESCR)
    VALUES
    (MOD(i.PM_INSTANCE_ID,1E16) /*apply modulus to instance number*/
    ,i.PM_TRANS_DEFN_SET, i.PM_TRANS_DEFN_ID, i.PM_AGENTID, i.PM_TRANS_STATUS,
    i.OPRID,
    SUBSTR('xPT'||i.PM_PERF_TRACE,1,30) /*adjust trace name*/,
    i.PM_CONTEXT_VALUE1, i.PM_CONTEXT_VALUE2, i.PM_CONTEXT_VALUE3,
    i.PM_CONTEXTID_1, i.PM_CONTEXTID_2, i.PM_CONTEXTID_3, i.PM_PROCESS_ID, i.PM_AGENT_STRT_DTTM,
    i.PM_MON_STRT_DTTM, i.PM_TRANS_DURATION,
    MOD(i.PM_PARENT_INST_ID,1E16), MOD(i.PM_TOP_INST_ID,1E16), /*apply modulus to parent and top instance number*/
    i.PM_METRIC_VALUE1, i.PM_METRIC_VALUE2, i.PM_METRIC_VALUE3, i.PM_METRIC_VALUE4, i.PM_METRIC_VALUE5,
    i.PM_METRIC_VALUE6, i.PM_METRIC_VALUE7, i.PM_ADDTNL_DESCR);
  END LOOP;
  COMMIT;
END;
/
- PeopleTools SQL. Metric value 7 reports the SQL operation and SQL table name. So if the first word is SELECT and the second word is a PeopleTools table name then it is a PeopleTools SQL operation. A list of PeopleTools tables can be obtained from the object security table PSOBJGROUP.
- Implicit Commit transactions. This is easy - it is just transaction type 425.
- Correct transaction duration for any parents of transaction. I work up the hierarchy of transactions and deduct the duration of the transaction that I am deleting from all of the parent.
- Transaction types 400, 427 and 428 all record PeopleTools SQL time (metric 66). When I come to that transaction I also deduct the duration of the deleted transaction from the PeopleTools SQL time metric in an parent transaction.
- Delete any children of the transactions that I delete.
- I must also count each PeopleTools SQL Execution transaction (type 408) and each PeopleTools SQL Fetch transaction (type 414) that I delete. These counts are also deducted from the summaries on the parent transaction 400.
Although this technique of first cloning the whole trace and then deleting the PeopleTools operations can be quite slow, it is not something that you are going to do very often.
REM xPT.sql
REM (c)Go-Faster Consultancy Ltd. 2014
set serveroutput on echo on
DECLARE
  l_pm_instance_id_m4 INTEGER;
  l_fetch_count INTEGER;
  l_exec_count INTEGER;
BEGIN /*now remove PeopleTools SQL transaction and any children and adjust trans durations*/
  FOR i IN (
    WITH x AS ( /*returns PeopleTools tables as defined in Object security*/
      SELECT o.entname recname
      FROM   psobjgroup o
      WHERE  o.objgroupid = 'PEOPLETOOLS'
      AND    o.enttype = 'R'
    )
    SELECT h.pm_instance_id, h.pm_parent_inst_id, h.pm_trans_duration, h.pm_trans_defn_id
    FROM   pspmtranshist h
           LEFT OUTER JOIN x
           ON h.pm_metric_value7 LIKE 'SELECT '||x.recname||'%'
           AND x.recname = upper(regexp_substr(pm_metric_value7,'[^ ,]+',8,1)) /*first word after select*/
    WHERE  pm_perf_trace like 'xPT%' /*restrict to cloned traces*/
--  AND    pm_perf_trace = 'xPT9b. XXXXXXXXXX' /*work on a specific trace*/
    AND    pm_instance_id < 1E16 /*restrict to cloned traces*/
    AND   (   x.recname IS NOT NULL
           OR h.pm_trans_defn_id IN(425 /*Implicit Commit*/))
    ORDER BY pm_instance_id DESC
  ) LOOP
    l_pm_instance_id_m4 := TO_NUMBER(NULL);
    IF i.pm_parent_inst_id>0 AND i.pm_trans_duration>0 THEN
      FOR j IN(
        SELECT  h.pm_instance_id, h.pm_parent_inst_id, h.pm_top_inst_id, h.pm_trans_defn_id
        ,       d.pm_metricid_3, d.pm_metricid_4
        FROM    pspmtranshist h
          INNER JOIN pspmtransdefn d
          ON         d.pm_trans_defn_set = h.pm_trans_defn_set
          AND        d.pm_trans_defn_id = h.pm_trans_Defn_id
        START WITH h.pm_instance_id = i.pm_parent_inst_id
        CONNECT BY prior h.pm_parent_inst_id = h.pm_instance_id
      ) LOOP
        /*decrement parent transaction times*/
        IF j.pm_metricid_4 = 66 /*PeopleTools SQL Time (ms)*/ THEN --decrement metric 4 on transaction 400
          --dbms_output.put_line('ID:'||i.pm_instance_id||' Type:'||i.pm_trans_defn_id||' decrement metric_value4 by '||i.pm_trans_duration);
          UPDATE pspmtranshist
          SET    pm_metric_value4 = pm_metric_value4 - i.pm_trans_duration
          WHERE  pm_instance_id = j.pm_instance_id
          AND    pm_trans_Defn_id = j.pm_trans_defn_id
          AND    pm_metric_value4 >= i.pm_trans_duration
          RETURNING pm_instance_id INTO l_pm_instance_id_m4;
        ELSIF j.pm_metricid_3 = 66 /*PeopleTools SQL Time (ms)*/ THEN --SQL time on serialisation
          --dbms_output.put_line('ID:'||i.pm_instance_id||' Type:'||i.pm_trans_defn_id||' decrement metric_value3 by '||i.pm_trans_duration);
          UPDATE pspmtranshist
          SET    pm_metric_value3 = pm_metric_value3 - i.pm_trans_duration
          WHERE  pm_instance_id = j.pm_instance_id
          AND    pm_trans_Defn_id = j.pm_trans_defn_id
          AND    pm_metric_value3 >= i.pm_trans_duration;
        END IF;

        UPDATE pspmtranshist
        SET    pm_trans_duration = pm_trans_duration - i.pm_trans_duration
        WHERE  pm_instance_id = j.pm_instance_id
        AND    pm_trans_duration >= i.pm_trans_duration;
      END LOOP;
    END IF;

    l_fetch_count := 0;
    l_exec_count := 0;
    FOR j IN( /*identify transaction to be deleted and any children*/
      SELECT  pm_instance_id, pm_parent_inst_id, pm_top_inst_id, pm_trans_defn_id, pm_metric_value3
      FROM    pspmtranshist
      START WITH pm_instance_id = i.pm_instance_id
      CONNECT BY PRIOR pm_instance_id = pm_parent_inst_id
    ) LOOP
      IF j.pm_trans_defn_id = 408 THEN /*if PeopleTools SQL*/
        l_exec_count := l_exec_count + 1;
      ELSIF j.pm_trans_defn_id = 414 THEN /*if PeopleTools SQL Fetch*/
        l_fetch_count := l_fetch_count + j.pm_metric_value3;
      END IF;
      DELETE FROM pspmtranshist h /*delete tools transaction*/
      WHERE h.pm_instance_id = j.pm_instance_id;
   END LOOP;

   IF l_pm_instance_id_m4 > 0 THEN
     --dbms_output.put_line('ID:'||l_pm_instance_id_m4||' Decrement '||l_exec_Count||' executions, '||l_fetch_count||' fetches');
     UPDATE pspmtranshist
     SET    pm_metric_value5 = pm_metric_value5 - l_exec_count
     ,      pm_metric_value6 = pm_metric_value6 - l_fetch_count
     WHERE  pm_instance_id = l_pm_instance_id_m4;
    l_fetch_count := 0;
    l_exec_count := 0;
   END IF;

  END LOOP;
END;
/
 |
| Figure 4: Original and Cloned PPM traces |
When I open the cloned trace, both timings in the duration summary have reduced as have the number of executions and fetches. The durations of the individual server round trips have also reduced.
 |
| Figure 5: Component Trace without PeopleTools transactions |
All of the PeopleTools SQL operations have disappeared from the SQL summary.
 |
| Figure 6: SQL Summary of PPM trace after removing PeopleTools SQL transactions |
The SQL summary now only has 125 rows of data.
 |
| Figure 7: SQL Summary of PMU without PeopleTools SQL |
Now, the PPM tree component opens quickly and without error.
 |
| Figure 8: PMU Tree after removing PeopleTools SQL |
There may still be more transactions in a PMU than I can show in a screenshot, but I can now find the statement that took the most time quite quickly.
 |
| Figure 9: Long SQL transaction further down same PMU tree |
Conclusions
I think that it is reasonable and useful to remove PeopleTools SQL operations from a PPM trace.In normal production operation, components will mostly be cached, and this approach renders traces collected in non-production environments both usable in the PPM analytic components and more realistic for performance tuning. However, it is essential that when deleting some transactions from a PMU, that summary data held in other transactions in the same PMU are also corrected so that the metrics remain consistent.
Wednesday, May 13, 2009
UKOUG PeopleSoft Conference 2009 Presentations
 The 2009 conference is past, but the agenda is still available on the UKOUG webiste, and if you are a UKOUG member or attended the conference, you can download the presentations.
I will be gave two new presentations that are on my website.
Sunday, December 21, 2008
Poor performance of PSPMSESSIONS_VW view affects Performance Monitor System Monitor Component
The System Performance Monitor component (PSPMSYSHEALTH; navigation: PeopleTools -> Performance Monitor -> System Performance) gives an overview of each system monitored by the PeopleSoft Performance Monitor. However, the poor performance of the view PSPMSESSIONS_VW can severely affect this component, to the extent that as transaction history builds up the component will not respond within the timeout.
Below is an extract from a PeopleTools trace. What happened is that the query ran until the Tuxedo service timed out. Tuxedo terminated application server process 31944, and spawned a new process (ID 3598). The user session received an error.
Even when each query finishes within a reasonable amount of time, the query can be run several times by the component.
This is the definition of PSPMSESSIONS_VW delivered by PeopleSoft.
Firstly, accurate object statistics are required on the transaction history table and its indexes.
An additional index is required on PSPMTRANSHIST:
Finally, I have changed the view.
The effect of these changes is a significant improvement in the performance of the query. I ran a test query for a single agent on a system with over 3 million rows on PSPMTRANSHIST:
Below is an extract from a PeopleTools trace. What happened is that the query ran until the Tuxedo service timed out. Tuxedo terminated application server process 31944, and spawned a new process (ID 3598). The user session received an error.
PSAPPSRV.31944 (70)   1-783    11.38.38    0.000072
Cur#1.31944.PMONITOR RC=0 Dur=0.000040 COM
Stmt=select count(*) from pspmsessions_vw where pm_agentid = :1
PSAPPSRV.31944 (70)   1-784    11.38.38    0.000008
Cur#1.31944.PMONITOR RC=0 Dur=0.000001
Bind-1 type=19 length=3 value=689
PSAPPSRV.3598 (112)   1-132    11.42.39  314.495972
Cur#1.3598.PMONITOR RC=0 Dur=0.000095 COM
Stmt=SELECT VERSION FROM PSVERSION WHERE OBJECTTYPENAME = 'SYS'
Even when each query finishes within a reasonable amount of time, the query can be run several times by the component.
This is the definition of PSPMSESSIONS_VW delivered by PeopleSoft.
SELECT T3.PM_CONTEXT_VALUE1
,      T3.PM_AGENTID
,      T3.PM_AGENT_STRT_DTTM
FROM   PSPMTRANSHIST T3
WHERE  T3.PM_TRANS_DEFN_ID = 116
AND    PM_TRANS_STATUS = '1'
AND    PM_TRANS_DURATION <> 0
AND    T3.PM_CONTEXT_VALUE1 IN (
SELECT T.PM_CONTEXT_VALUE1
FROM   PSPMTRANSHIST T
WHERE  T.PM_TRANS_DEFN_SET = 1
AND    T.PM_TRANS_DEFN_ID = 109
AND    T.PM_MON_STRT_DTTM > %TimeAdd(%CurrentDateTimeIn, -720)
AND    T.PM_PARENT_INST_ID <> PM_TOP_INST_ID
AND    T.PM_CONTEXT_VALUE1 NOT IN (
 SELECT T2.PM_CONTEXT_VALUE1
 FROM   PSPMTRANSHIST T2
 WHERE  T2.PM_TRANS_DEFN_SET = 1
 AND    T2.PM_TRANS_DEFN_ID = 108
 AND    T2.PM_CONTEXT_VALUE1 = T.PM_CONTEXT_VALUE1
 AND    T2.PM_MON_STRT_DTTM > %TimeAdd(%CurrentDateTimeIn, -720)))
Firstly, accurate object statistics are required on the transaction history table and its indexes.
An additional index is required on PSPMTRANSHIST:
CREATE INDEX PSPPSPMTRANSHIST ON PSPMTRANSHIST
(PM_TRANS_DEFN_SET
,PM_TRANS_DEFN_ID
,PM_CONTEXT_VALUE1
,PM_MON_STRT_DTTM)
TABLESPACE PSINDEX PCTFREE 0
PARALLEL NOLOGGING COMPRESS 3
/
ALTER INDEX PSPPSPMTRANSHIST NOPARALLEL LOGGING
/
Finally, I have changed the view.
- The IN() operators have been changed to WHERE EXISTS(). The new index supports the efficient execution of these sub-queries.
- The sub-queries are now both correlated back to the main query on T3.
- The ROWNUM criteria have been added to restrict the number of rows the sub-queries can return.
SELECT T3.PM_CONTEXT_VALUE1 /*Session ID*/
,      T3.PM_AGENTID
,      T3.PM_AGENT_STRT_DTTM
FROM   PSPMTRANSHIST T3
WHERE  T3.PM_TRANS_DEFN_ID = 116 /*Redirect after login*/
AND    T3.PM_TRANS_DEFN_SET = 1 /*added*/
AND    T3.PM_TRANS_STATUS = '1'
AND    T3.PM_TRANS_DURATION <> 0
AND EXISTS(
SELECT 'x'
FROM   PSPMTRANSHIST T
WHERE  T.PM_TRANS_DEFN_SET = 1
AND    T.PM_TRANS_DEFN_ID = 109 /*User Session Began*/
AND    T.PM_MON_STRT_DTTM > %TimeAdd(%CurrentDateTimeIn, -720)
AND    T.PM_PARENT_INST_ID <> T.PM_TOP_INST_ID
AND    T.PM_CONTEXT_VALUE1 = T3.PM_CONTEXT_VALUE1
AND NOT EXISTS(
 SELECT 'x'
 FROM   PSPMTRANSHIST T2
 WHERE  T2.PM_TRANS_DEFN_SET = 1
 AND    T2.PM_TRANS_DEFN_ID = 108 /*User Session Ended*/
 AND    T2.PM_MON_STRT_DTTM > %TimeAdd(%CurrentDateTimeIn, -720)
 AND    T2.PM_CONTEXT_VALUE1 = T3.PM_CONTEXT_VALUE1
 AND    ROWNUM <= 1)
 AND    ROWNUM <= 1)
The effect of these changes is a significant improvement in the performance of the query. I ran a test query for a single agent on a system with over 3 million rows on PSPMTRANSHIST:
- Original: 24895 consistent gets
- New Index: 22547 consistent gets
- and View Changes: 85 consistent gets
Monday, August 04, 2008
Serious fault with PeopleSoft Performance Monitor fixed in PeopleTools 8.49.14
Regular readers of my ramblings will know that I spend a lot of my time working with the PeopleSoft Performance Monitor (PPM). It is an extremely valuable source of performance metrics that are mostly not available, or if they are just difficult to obtain and process.
In PeopleTools 8.49, PPM has a serious fault. It is very similar to scenario reported for PeopleTools 8.44 in GSC Solution 200769188: PerfMon: Too many httpd processes spawned/sockets opened when using PerfMon.
"When a 404 is returned from the monitor server the calling agent code only checks the HTTP return code but does not flush the input stream. This causes the connection to remain open until the GC finally closes the input steam which closes the open connection. This is easily detected by the increasing list of sockets in CLOSE_WAIT state [, as reported by netstat]. On NT there is no hard limit on file descriptors and therefore a crash is not noticed. On Unix platforms this can cause the process to run out of file descriptors before the JVM GC has a chance to run and free up the sockets."
Hence, when running the application server on Unix, you will reach a point where JSH processes cannot open new ports and PIA users can receive the 'Application Server is Down' message. So, this can cause the system to become unavailable until the application server is rebooted. To prevent this occurring, the PPM must be deconfigured. The Monitor URL should be set to 'NONE'.
According to PeopleSoft Global Support this problem will be resolved in PeopleTools 8.49 patch 14.
Monday, May 26, 2008
Performance Tuning the Performance Monitor Archive Process
I have been working with a PeopleSoft Performance Monitor (PPM) system that is collecting data for 7 monitored systems. Three of those systems are very active. We want to keep data for a rolling 7 days. We reached the point where the PPM archive process could not rows as fast as they were arriving! I have, of course, reduced the sample frequency of events and transactions, but the PPM is receiving between 20 and 30 million rows of history data per week.
It is also worth remarking here that since the application servers, web servers and Process Schedulers were moved to commodity Intel hardware there are now a larger number of these components, and PPM is receiving more event data.
I have taken a look inside the PPM archive process. PPM history data is removed by a PeopleCode program (PSPM_ARCHIVE.ARCHIVE.GBL.default.ARCPCODE.OnExecute) that is called from the Application Engine.
Rows of transaction date to be archived are identified by the following SQL (and there is a similar one for event data):
Lets look at the last condition in the WHERE clause (in bold). It uses the %DateTimeDiff PeopleCode macro to calculate the age of the row of data. This expands to.
However, putting a function around a column prevents the database from using any index on that column. In this case it is not possible to create an function-based index to satisfy this expression because it contains SYSDATE.
The reaction of Oracle's Optimizer is to full scan the PSPMTRANSHIST table. With millions of rows of data in this table, a full scan is simply not going to perform adequately.
Instead, I would rather code something simple, but Oracle specific (and if I am going to do Oracle specific date arithmetic then there is no need to use %CurrentDateTimeIn).
The PeopleCode can be adjusted to be sensitive to the database platform like this.
and similarly for event data
The resulting query needs an index on PM_AGENTID and PM_MON_STRT_DTTM (on both PSPMTRANSHIST and PSPMEVENTHIST). There are delivered indexes that lead on the PM_AGENTID and have PM_MON_STRT_DTTM further down, but a dedicated index is beneficial.
It is also worth remarking here that since the application servers, web servers and Process Schedulers were moved to commodity Intel hardware there are now a larger number of these components, and PPM is receiving more event data.
I have taken a look inside the PPM archive process. PPM history data is removed by a PeopleCode program (PSPM_ARCHIVE.ARCHIVE.GBL.default.ARCPCODE.OnExecute) that is called from the Application Engine.
Rows of transaction date to be archived are identified by the following SQL (and there is a similar one for event data):
&TransHistSQL.Open("SELECT X.PM_INSTANCE_ID, X.PM_TRANS_DEFN_SET, X.PM_TRANS_DEFN_ID, X.PM_AGENTID, X.PM_TRANS_STATUS, X.OPRID, X.PM_PERF_TRACE, X.PM_CONTEXT_VALUE1, X.PM_CONTEXT_VALUE2, X.PM_CONTEXT_VALUE3, X.PM_CONTEXTID_1, X.PM_CONTEXTID_2, X.PM_CONTEXTID_3, X.PM_PROCESS_ID, %DateTimeOut(X.PM_AGENT_STRT_DTTM), %DateTimeOut(X.PM_MON_STRT_DTTM), X.PM_TRANS_DURATION, X.PM_PARENT_INST_ID, X.PM_TOP_INST_ID, X.PM_METRIC_VALUE1, X.PM_METRIC_VALUE2, X.PM_METRIC_VALUE3, X.PM_METRIC_VALUE4, X.PM_METRIC_VALUE5, X.PM_METRIC_VALUE6, X.PM_METRIC_VALUE7, X.PM_ADDTNL_DESCR, Z.PM_ARCHIVE_MODE FROM PSPMTRANSHIST X, PSPMAGENT Y, PSPMSYSDEFN Z WHERE X.PM_AGENTID=Y.PM_AGENTID AND Y.PM_SYSTEMID=Z.PM_SYSTEMID AND (Z.PM_ARCHIVE_MODE='1' OR Z.PM_ARCHIVE_MODE='2') AND %DateTimeDiff(X.PM_MON_STRT_DTTM, %CurrentDateTimeIn) >= (PM_MAX_HIST_AGE * 24 * 60)");
Lets look at the last condition in the WHERE clause (in bold). It uses the %DateTimeDiff PeopleCode macro to calculate the age of the row of data. This expands to.
… AND ROUND((CAST(( SYSDATE) AS DATE) - CAST((X.PM_MON_STRT_DTTM) AS DATE)) * 1440, 0) >= (PM_MAX_HIST_AGE * 24 * 60)
However, putting a function around a column prevents the database from using any index on that column. In this case it is not possible to create an function-based index to satisfy this expression because it contains SYSDATE.
The reaction of Oracle's Optimizer is to full scan the PSPMTRANSHIST table. With millions of rows of data in this table, a full scan is simply not going to perform adequately.
Instead, I would rather code something simple, but Oracle specific (and if I am going to do Oracle specific date arithmetic then there is no need to use %CurrentDateTimeIn).
… AND X.PM_MON_STRT_DTTM <= SYSDATE - PM_MAX_HIST_AGE
The PeopleCode can be adjusted to be sensitive to the database platform like this.
…
/*-- SELECT THE ROWS FROM PSPMTRANSHIST ELIGLIBLE FOR ARCHIVING */
If %DbType = "ORACLE" Then /*dmk 19.5.2008 oracle specific performance tuning*/
&TransHistSQL.Open("SELECT X.PM_INSTANCE_ID, X.PM_TRANS_DEFN_SET, X.PM_TRANS_DEFN_ID, X.PM_AGENTID, X.PM_TRANS_STATUS, X.OPRID, X.PM_PERF_TRACE, X.PM_CONTEXT_VALUE1, X.PM_CONTEXT_VALUE2, X.PM_CONTEXT_VALUE3, X.PM_CONTEXTID_1, X.PM_CONTEXTID_2, X.PM_CONTEXTID_3, X.PM_PROCESS_ID, %DateTimeOut(X.PM_AGENT_STRT_DTTM), %DateTimeOut(X.PM_MON_STRT_DTTM), X.PM_TRANS_DURATION, X.PM_PARENT_INST_ID, X.PM_TOP_INST_ID, X.PM_METRIC_VALUE1, X.PM_METRIC_VALUE2, X.PM_METRIC_VALUE3, X.PM_METRIC_VALUE4, X.PM_METRIC_VALUE5, X.PM_METRIC_VALUE6, X.PM_METRIC_VALUE7, X.PM_ADDTNL_DESCR, Z.PM_ARCHIVE_MODE FROM PSPMTRANSHIST X, PSPMAGENT Y, PSPMSYSDEFN Z WHERE X.PM_AGENTID=Y.PM_AGENTID AND Y.PM_SYSTEMID=Z.PM_SYSTEMID AND (Z.PM_ARCHIVE_MODE='1' OR Z.PM_ARCHIVE_MODE='2') AND X.PM_MON_STRT_DTTM <= SYSDATE - PM_MAX_HIST_AGE
/*-- SELECT THE ROWS FROM PSPMTRANSHIST ELIGLIBLE FOR ARCHIVING */
If %DbType = "ORACLE" Then /*dmk 19.5.2008 oracle specific performance tuning*/
&TransHistSQL.Open("SELECT X.PM_INSTANCE_ID, X.PM_TRANS_DEFN_SET, X.PM_TRANS_DEFN_ID, X.PM_AGENTID, X.PM_TRANS_STATUS, X.OPRID, X.PM_PERF_TRACE, X.PM_CONTEXT_VALUE1, X.PM_CONTEXT_VALUE2, X.PM_CONTEXT_VALUE3, X.PM_CONTEXTID_1, X.PM_CONTEXTID_2, X.PM_CONTEXTID_3, X.PM_PROCESS_ID, %DateTimeOut(X.PM_AGENT_STRT_DTTM), %DateTimeOut(X.PM_MON_STRT_DTTM), X.PM_TRANS_DURATION, X.PM_PARENT_INST_ID, X.PM_TOP_INST_ID, X.PM_METRIC_VALUE1, X.PM_METRIC_VALUE2, X.PM_METRIC_VALUE3, X.PM_METRIC_VALUE4, X.PM_METRIC_VALUE5, X.PM_METRIC_VALUE6, X.PM_METRIC_VALUE7, X.PM_ADDTNL_DESCR, Z.PM_ARCHIVE_MODE FROM PSPMTRANSHIST X, PSPMAGENT Y, PSPMSYSDEFN Z WHERE X.PM_AGENTID=Y.PM_AGENTID AND Y.PM_SYSTEMID=Z.PM_SYSTEMID AND (Z.PM_ARCHIVE_MODE='1' OR Z.PM_ARCHIVE_MODE='2') AND X.PM_MON_STRT_DTTM <= SYSDATE - PM_MAX_HIST_AGE
and similarly for event data
…
/*-- SELECT THE ROWS FROM PSPMEVENTHIST ELIGLIBLE FOR ARCHIVING */
If %DbType = "ORACLE" Then
/*dmk 19.5.2008 - oracle specific performance tuning*/
&EventHistSQL.Open("SELECT X.PM_INSTANCE_ID, X.PM_EVENT_DEFN_SET, X.PM_EVENT_DEFN_ID, X.PM_AGENTID, %DateTimeOut(X.PM_AGENT_DTTM), %DateTimeOut(X.PM_MON_DTTM), X.PM_PROCESS_ID, X.PM_FILTER_LEVEL,X.PM_METRIC_VALUE1, X.PM_METRIC_VALUE2, X.PM_METRIC_VALUE3, X.PM_METRIC_VALUE4, X.PM_METRIC_VALUE5, X.PM_METRIC_VALUE6, X.PM_METRIC_VALUE7, X.PM_ADDTNL_DESCR, Z.PM_ARCHIVE_MODE FROM PSPMEVENTHIST X, PSPMAGENT Y, PSPMSYSDEFN Z WHERE X.PM_AGENTID=Y.PM_AGENTID AND Y.PM_SYSTEMID=Z.PM_SYSTEMID AND (Z.PM_ARCHIVE_MODE='1' OR Z.PM_ARCHIVE_MODE='2') AND X.PM_MON_DTTM <= SYSDATE - PM_MAX_HIST_AGE
/*-- SELECT THE ROWS FROM PSPMEVENTHIST ELIGLIBLE FOR ARCHIVING */
If %DbType = "ORACLE" Then
/*dmk 19.5.2008 - oracle specific performance tuning*/
&EventHistSQL.Open("SELECT X.PM_INSTANCE_ID, X.PM_EVENT_DEFN_SET, X.PM_EVENT_DEFN_ID, X.PM_AGENTID, %DateTimeOut(X.PM_AGENT_DTTM), %DateTimeOut(X.PM_MON_DTTM), X.PM_PROCESS_ID, X.PM_FILTER_LEVEL,X.PM_METRIC_VALUE1, X.PM_METRIC_VALUE2, X.PM_METRIC_VALUE3, X.PM_METRIC_VALUE4, X.PM_METRIC_VALUE5, X.PM_METRIC_VALUE6, X.PM_METRIC_VALUE7, X.PM_ADDTNL_DESCR, Z.PM_ARCHIVE_MODE FROM PSPMEVENTHIST X, PSPMAGENT Y, PSPMSYSDEFN Z WHERE X.PM_AGENTID=Y.PM_AGENTID AND Y.PM_SYSTEMID=Z.PM_SYSTEMID AND (Z.PM_ARCHIVE_MODE='1' OR Z.PM_ARCHIVE_MODE='2') AND X.PM_MON_DTTM <= SYSDATE - PM_MAX_HIST_AGE
The resulting query needs an index on PM_AGENTID and PM_MON_STRT_DTTM (on both PSPMTRANSHIST and PSPMEVENTHIST). There are delivered indexes that lead on the PM_AGENTID and have PM_MON_STRT_DTTM further down, but a dedicated index is beneficial.
Thursday, April 27, 2006
Measuring Network Latency with the PeopleSoft Performance Monitor Transaction 116
One of the things I am using this blog for is as an addendum to the book. When I wrote the chapter about performance monitor, I had never used it in a real production scenario. Since publication, I have learnt a lot more about it. One of the things that I missed was transaction 116, 'Redirected round trip time (network latency)'.
When you log into the PIA the browser, the browser is redirected to another page. I understand this transaction to measure the time taken for the login page with the redirection tag to go from the web server to browser, to be processed on the browser, and for the browser to return the page to which it was redirected. Thus it measures the latency of a return trip on the network. This and PeopleSoft Ping are the only metrics that PeopleSoft generates that indicate the performance of network between the web server and a user's workstation.
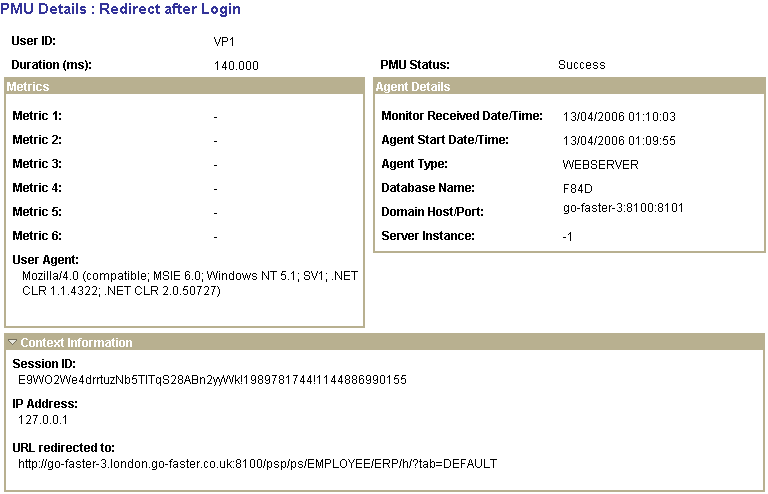
This transaction holds various pieces of information about the user's PC, including its IP address (although that might be the address of a firewall or load balancer), the user's Session ID on the web server, and the user agent information, from which you can determine the browser and version, and the operating system of their workstation.
So now, if you know where a user is physically located, you may be able to detect a correlation between location and the round trip during. One limitation is that this transaction is only collected when a user logs in, and so you may not collect data points when you need them.
Tuesday, April 25, 2006
Performance Tuning the Performance Monitor
I am a big fan of the PeopleSoft Performance Monitor, but the more often I use it I discover it has a few rough edges. Some of the analytics components do not perform well when their is either a large amount of data in the PSPMTRANSHIST table, or when there are a lot of agents in a system. So I have used the Performance Monitor to trace the Performance Monitor
components.
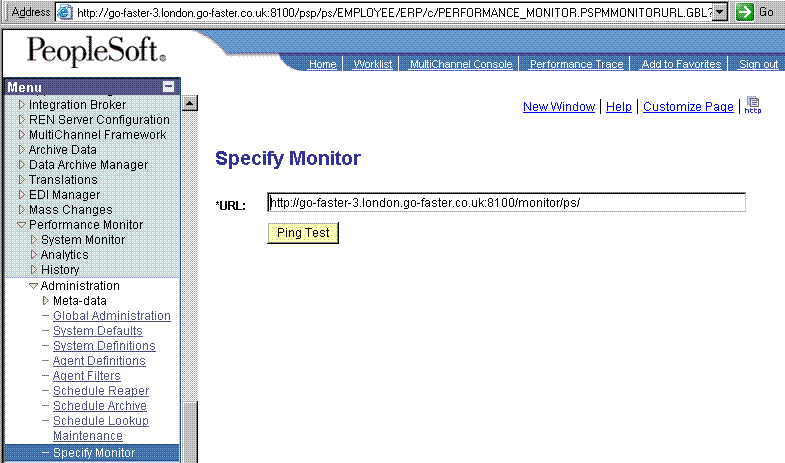
You have to configure it to self-monitor, ignoring all the warning messages.
components.
You have to configure it to self-monitor, ignoring all the warning messages.
But, you are not interested in the sampled statistics on this database, so disable monitoring by setting the filter level on all agents to standby.
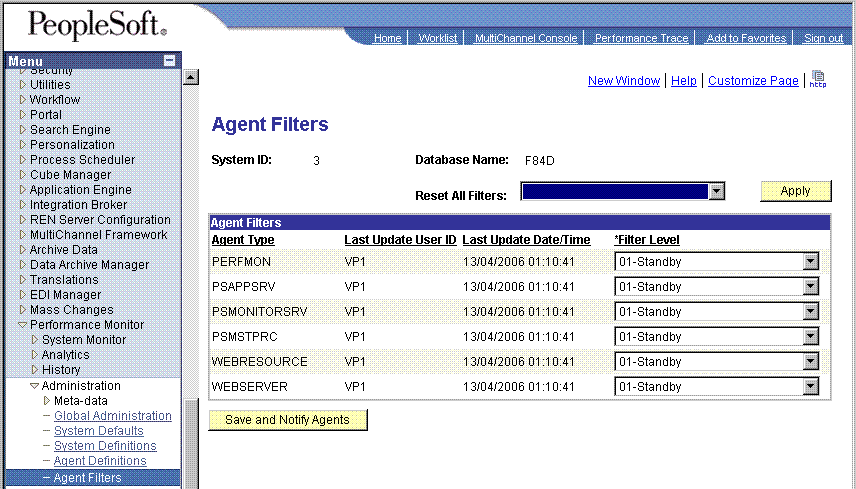 Instead enable Performance Trace with either Verbose or Debug
 The component trace indicates which analytic queries take the most time.
I have changed and added the following indexes to the performance tables.
CREATE INDEX PSDPSPMEVENTHIST ON PSPMEVENTHIST
(PM_EVENT_DEFN_SET, PM_EVENT_DEFN_ID, PM_AGENTID, PM_AGENT_DTTM)
TABLESPACE PSINDEX ... PCTFREE 1 COMPRESS 3
/
CREATE INDEX PSCPSPMTRANSHIST ON PSPMTRANSHIST
(
PM_TRANS_DEFN_SET,PM_TRANS_DEFN_ID, PM_PERF_TRACE,PM_METRIC_VALUE7
/*,PM_MON_STRT_DTTM */
) TABLESPACE PSINDEX ... PCTFREE 1 COMPRESS 4
/
CREATE INDEX PSDPSPMTRANSHIST ON PSPMTRANSHIST
(PM_TOP_INST_ID, PM_TRANS_DEFN_SET, PM_TRANS_DEFN_ID)
TABLESPACE PSINDEX ... PCTFREE 1
COMPRESS 3
/
The Performance Monitor tables (PSPMTRANSHIST, PSPMTRANSARCH, PSPMEVENTHIST, PSPMEVENTARCH) are never updated. The performance collator application server process (PSPPMSRV) inserts data into the performance monitor tables, and later the performance monitor archive Appliction Engine process (PSPM_ARCHIVE) will insert them into the %ARCH tables, and delete them from the %HIST tables. Therefore, it is sensible to pack the data by minimising free space in these tables, and so reduce both logical and phyiscal I/O. So
I have reduced the free space in the data blocks (PCTFREE) to 0% on tables and indexes, and increased PCTUSED to 99%.
I have also found it beneficial to collect histograms on certain columns
BEGIN
sys.dbms_stats.gather_table_Stats
(ownname => 'SYSADM'
,tabname => 'PSPMTRANSHIST'
,estimate_percent => DBMS_STATS.AUTO_SAMPLE_SIZE
,method_opt => 'FOR COLUMNS PM_PERF_TRACE, PM_TRANS_DEFN_ID,
pm_metric_value7'
,cascade => TRUE
);
END;
/
If you have performance problems with Performance Monitor, remember that you can also use Performance Monitor to analyse its own analytics.
Subscribe to:
Posts
(
Atom
)


 @go-faster.co.uk on BlueSky

 Posts
Posts