Monday, February 16, 2015

PeopleTools 8.54: Descending Indexes are not supported

This is the first in a series of articles about new features and differences in PeopleTools 8.54 that will be of interest to the Oracle DBA.

"With PeopleTools 8.54, PeopleTools will no longer support descending indexes on the Oracle database platform" - PeopleTools 8.54 Release Notes

They have gone again!  Forgive the trip down memory lane, but I think it is worth reviewing their history.
  • Prior to PeopleTools 8.14, if you specified a key or alternate search field in record as descending then where it appeared in automatically generated key and alternate search key indexes, that column would be descending.  PeopleTools would add the DESC keyword after the column in the CREATE INDEX DDL.  Similarly, columns can be specified as descending in user indexes (that is to say ones created by the developer with index ID A through Z).
  • In PeopleTools 8.14 to 8.47, descending indexes were not built by Application Designer because of a problem with the descending key indexes in some versions of Oracle 8i.  
    • PeopleSoft had previously recommended setting an initialisation parameter on 8i to prevent descending indexes from being created even if the DESC keyword was specified.parameters.
_IGNORE_DESC_IN_INDEX=TRUE
  • From PeopleTools 8.48 the descending keyword came back because this was the first version of PeopleTools that was only certified from Oracle 9i, in which the descending index bug never occurred. (see blog posting 'Descending Indexes are Back!' October 2007).
  • In PeopleTools 8.54, there are again no descending indexes because the descending keyword has been omitted from the column list in the CREATE TABLE DDL. You can still specify descending keys in Application Designer because that controls the order in which rows are queried into scrolls in the PIA.  You can also still specify descending order on user indexes, but it has no effect upon either the application or the index DDL.
I haven’t found any documentation that explains why this change has been made.  This time there is no suggestion of a database bug.  However, I think that there are a good database design reasons behind it.

Normally creation of a primary key automatically creates a unique index to police the constraint.  It is possible to create a primary key constraint using a pre-existing index.  The index does not have to be unique, but it may as well.  However, there are some limitations.
  • You cannot create primary key on nullable columns - that is a fundamental part of the relational model.  This is rarely a problem in PeopleSoft where only dates that are not marked 'required' in the Application Designer are created nullable in the database.
    • You can create a unique index on nullable columns, which is probably why PeopleSoft has always used unique indexes.  
  • You cannot use a descending index in a primary key constraint because it is implemented as a function-based index.
CREATE TABLE t (a NUMBER NOT NULL)
/
CREATE UNIQUE INDEX t1 ON t(A DESC)
/
ALTER TABLE t ADD PRIMARY KEY (a) USING INDEX t1
/
ORA-14196: Specified index cannot be used to enforce the constraint.
    • We can see that the descending key column is actually a function of a column and not a column, and so cannot be used in a primary key.
SELECT index_name, index_type, uniqueness FROM user_indexes WHERE table_name = 'T'
/

INDEX_NAME INDEX_TYPE                  UNIQUENES
---------- --------------------------- ---------
T1         FUNCTION-BASED NORMAL       UNIQUE 

SELECT index_name, column_name, column_position, descend FROM user_ind_columns WHERE table_name = 'T'
/

INDEX_NAME COLUMN_NAME  COLUMN_POSITION DESC
---------- ------------ --------------- ----
T1         SYS_NC00002$               1 DESC

SELECT * FROM user_ind_expressions WHERE table_name = 'T'
/

INDEX_NAME TABLE_NAME COLUMN_EXPRESSION    COLUMN_POSITION
---------- ---------- -------------------- ---------------
T1         T          "A"                                1
    • Non-PeopleSoft digression: you can create a primary key on a virtual column.  An index on the virtual column is not function-based.  So you can achieve the same effect if you move the function from the index into a virtual column, and you can have a primary key on the function.  However, PeopleTools Application Designer doesn't support virtual columns.
I think that descending keys have removed from PeopleTools because:
  • It permits the creation of primary key constraints using the unique indexes.
  • It does not pose any performance threat.  In Oracle, index leaf blocks are chained in both directions so it is possible to use an ascending index for a descending scan and vice versa. 
  • Update 20.4.2016: There is an optimisation in Oracle 11.2.0.4 that improves the performance of the MAX() function in correlated sub-queries on ascending indexes only.  This will benefit all PeopleSoft applications, but especially HCM.
What are the advantages of having a primary key rather than just a unique constraint?
  • The optimizer can only consider certain SQL transformations if there is a primary key.  That mainly affects star transformation.
  • It allows the optimizer to rewrite a query to use a materialized view. 
  • It allows a materialized view refresh to be based on the primary key rather than the rowid (the physical address of the row in a table).  This can save you from performing a full refresh of the materialized view if you rebuild the table (I will come back to materialized views in another posting).
  • If you are using logical standby, you need to be able to uniquely identify a row of data otherwise Oracle will perform supplemental logging.  Oracle will additionally log all bounded-size columns (in PeopleSoft, that means everything except LOBs).  Oracle can use non-null unique constraint, but it cannot use a unique function-based index.
    • Logical standby can be a useful way to minimise downtime during a migration.  For example, when migrating the database from a proprietary Unix to Linux where there is an Endian change.  Minimising supplemental logging would definitely be of interest in this case.
The descending index change is not something that can be configured by the developer or administrator.  It is just something that is hard coded in Application Design and Data Mover that changes the DDL that they generate.

There are some considerations on migration to PeopleTools 8.54:
  • It will be necessary to rebuild all indexes with descending keys to remove the descending keys.  
  • There are a lot of descending indexes in a typical PeopleSoft application (I counted the number of function-based indexes in a typical system: HR ~11000 , Financials: ~8500).  If you choose to do this during the migration it may take considerable time.
  • In Application Designer, if your build script settings are set to only recreate an index if modified, Application Designer will not detect that the index has a descending key and rebuild it.  So you will have to work out for yourself which indexes have descending key columns and handle the rebuild manually.
  • With migration to PeopleTools 8.54 in mind, you might choose to prevent Oracle from building descending indexes by setting _IGNORE_DESC_IN_INDEX=TRUE. Then you can handle the rebuild in stages in advance

Conclusion

I think the removal of descending indexes from PeopleSoft is a sensible change that enables a number of Oracle database features, while doing no harm.

PeopleTools 8.54 for the Oracle DBA

The UKOUG PeopleSoft Roadshow 2015 comes to London on 31st March 2015.  In a moment of enthusiasm, I offered to talk about new and interesting features of PeopleTools 8.54 from the perspective of an Oracle DBA.

I have been doing some research, and have even read the release notes!  As a result, I have picked out some topics that I want to talk about.  I will discuss how the feature has been implemented, and what I think are the benefits and drawbacks of the feature:
This post is not about a new feature in PeopleTools 8.54, but it is something that I discovered while investigating the new version.
Links have been added to the above list as I have also blogged about each.  I hope it might produce some feedback and discussion.  After the Roadshow I will also add a link to the presentation.

PeopleTools 8.54 is still quite new, and we are all still learning.  So please leave comments, disagree with what I have written, correct things that I have got wrong, ask questions.

Monday, November 03, 2014

Filtering PeopleTools SQL from Performance Monitor Traces


I have been doing some on-line performance tuning on a PeopleSoft Financials system using PeopleSoft Performance Monitor (PPM).  End-users have collect verbose PPM traces. Usually, when I use PPM in a production system, all the components are fully cached by the normal activity of the user (except when the application server caches have recently been cleared).  However, when working in a user test environment it is common to find that the components are not fully cached. This presents two problems.
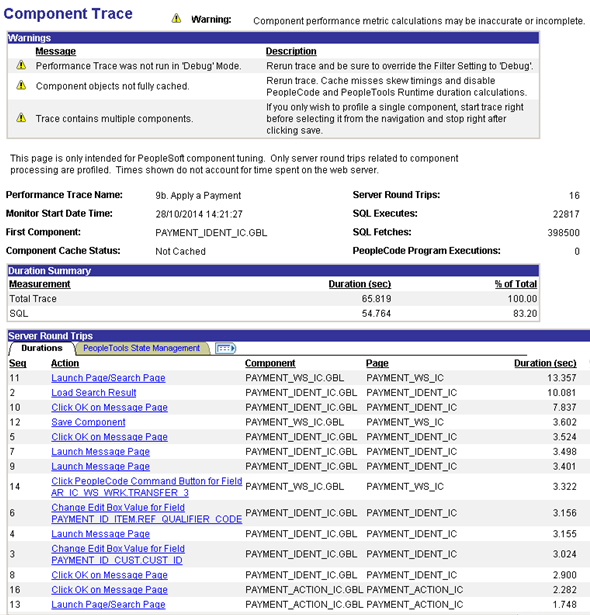
  • The application servers spend quite a lot of time executing queries on the PeopleTools tables to load the components, pages and PeopleCode into their caches. We can see in the screenshot of the component trace that there is a warning message that component objects are not fully cached, and that these  cache misses skew timings.
  • In verbose mode, the PPM traces collect a lot of additional transactions capturing executions and fetches against PeopleTools tables. The PPM analytic components cannot always manage the resultant volume of transactions.
Figure 1. Component trace as collected by PPM
If I go further down the same page and look in the SQL Summary, I can see SQL operations against PeopleTools tables (they are easily identifiable in that they generally do not have an underscore in the third character). Not only are 5 of the top 8 SQL operations related to PeopleTools tables, we can also see that they also account for over 13000 executions, which means there are at least 13000 rows of additional data to be read from PSPMTRANSHIST.
Figure 2. SQL Summary of PPM trace with PeopleTools SQL
When I open the longest running server round trip (this is also referred to as a Performance Monitoring Unit or PMU), I can only load 1001 rows before I get a message warning that the maximum row limit has been reached. The duration summary and the number of executions and fetches cannot be calculated and hence 0 is displayed.
Figure 3: Details of longest PMU with PeopleTools SQL

Another consequence of the PeopleTools data is that it can take a long time to open the PMU tree. There is no screenshot of the PMU tree here because in this case I had so much data that I couldn't open it before the transaction timed out!

Solution 

My solution to this problem is to delete the transactions that relate to PeopleTools SQL and correct the durations, and the number of executions and fetches held in summary transactions. The rationale is that these transactions would not normally occur in significant quantities in a real production system, and there is not much I can do about them when they do.
The first step is to clone the trace. I could work on the trace directly, but I want to preserve the original data.
PPM transactions are held in the table PSPMTRANSHIST. They have a unique identifier PM_INSTANCE_ID. A single server round trip, also called a Performance Monitoring Unit (PMU), will consist of many transactions. They can be shown as a tree and each transaction has another field PM_PARENT_INST_ID which holds the instance of the parent. This links the data together and we can use hierarchical queries in Oracle SQL to walk the tree. Another field PM_TOP_INST_ID identifies the root transaction in the tree.
Cloning a PPM trace is simply a matter of inserting data into PSPMTRANSHIST. However, when I clone a PPM trace I have to make sure that the instance numbers are distinct but still link correctly. In my system I can take a very simple approach. All the instance numbers actually collected by PPM are greater than 1016. So, I will simply use the modulus function to consistently alter the instances to be different. This approach may break down in future, but it will do for now.
On an Oracle database, PL/SQL is a simple and effective way to write simple procedural processes.  I have written two anonymous blocks of code.
Note that the cloned trace will be purged from PPM like any other data by the delivered PPM archive process.

REM xPT.sql
BEGIN --duplicate PPM traces
  FOR i IN (
    SELECT h.*
    FROM   pspmtranshist h
    WHERE  pm_perf_trace != ' ' /*rows must have a trace name*/
--  AND    pm_perf_trace = '9b. XXXXXXXXXX' /*I could specify a specific trace by name*/
    AND    pm_instance_id > 1E16 /*only look at instance > 1e16 so I do not clone cloned traces*/
  ) LOOP
    INSERT INTO pspmtranshist 
    (PM_INSTANCE_ID, PM_TRANS_DEFN_SET, PM_TRANS_DEFN_ID, PM_AGENTID, PM_TRANS_STATUS,
    OPRID, PM_PERF_TRACE, PM_CONTEXT_VALUE1, PM_CONTEXT_VALUE2, PM_CONTEXT_VALUE3,
    PM_CONTEXTID_1, PM_CONTEXTID_2, PM_CONTEXTID_3, PM_PROCESS_ID, PM_AGENT_STRT_DTTM,
    PM_MON_STRT_DTTM, PM_TRANS_DURATION, PM_PARENT_INST_ID, PM_TOP_INST_ID, PM_METRIC_VALUE1,
    PM_METRIC_VALUE2, PM_METRIC_VALUE3, PM_METRIC_VALUE4, PM_METRIC_VALUE5, PM_METRIC_VALUE6,
    PM_METRIC_VALUE7, PM_ADDTNL_DESCR)
    VALUES
    (MOD(i.PM_INSTANCE_ID,1E16) /*apply modulus to instance number*/
    ,i.PM_TRANS_DEFN_SET, i.PM_TRANS_DEFN_ID, i.PM_AGENTID, i.PM_TRANS_STATUS,
    i.OPRID, 
    SUBSTR('xPT'||i.PM_PERF_TRACE,1,30) /*adjust trace name*/,
    i.PM_CONTEXT_VALUE1, i.PM_CONTEXT_VALUE2, i.PM_CONTEXT_VALUE3,
    i.PM_CONTEXTID_1, i.PM_CONTEXTID_2, i.PM_CONTEXTID_3, i.PM_PROCESS_ID, i.PM_AGENT_STRT_DTTM,
    i.PM_MON_STRT_DTTM, i.PM_TRANS_DURATION, 
    MOD(i.PM_PARENT_INST_ID,1E16), MOD(i.PM_TOP_INST_ID,1E16), /*apply modulus to parent and top instance number*/
    i.PM_METRIC_VALUE1, i.PM_METRIC_VALUE2, i.PM_METRIC_VALUE3, i.PM_METRIC_VALUE4, i.PM_METRIC_VALUE5, 
    i.PM_METRIC_VALUE6, i.PM_METRIC_VALUE7, i.PM_ADDTNL_DESCR);
  END LOOP;
  COMMIT;
END;
/ 
Now I will work on the cloned trace. I want to remove certain transaction.
  • PeopleTools SQL. Metric value 7 reports the SQL operation and SQL table name. So if the first word is SELECT and the second word is a PeopleTools table name then it is a PeopleTools SQL operation. A list of PeopleTools tables can be obtained from the object security table PSOBJGROUP.
  • Implicit Commit transactions. This is easy - it is just transaction type 425. 
Having deleted the PeopleTools transactions, I must also
  • Correct transaction duration for any parents of transaction. I work up the hierarchy of transactions and deduct the duration of the transaction that I am deleting from all of the parent.
  • Transaction types 400, 427 and 428 all record PeopleTools SQL time (metric 66). When I come to that transaction I also deduct the duration of the deleted transaction from the PeopleTools SQL time metric in an parent transaction.
  • Delete any children of the transactions that I delete. 
  • I must also count each PeopleTools SQL Execution transaction (type 408) and each PeopleTools SQL Fetch transaction (type 414) that I delete. These counts are also deducted from the summaries on the parent transaction 400. 
The summaries in transaction 400 are used on the 'Round Trip Details' components, and if they are not adjusted you can get misleading results. Without the adjustments, I have encountered PMUs where more than 100% of the total duration is spent in SQL - which is obviously impossible.
Although this technique of first cloning the whole trace and then deleting the PeopleTools operations can be quite slow, it is not something that you are going to do very often. 
REM xPT.sql
REM (c)Go-Faster Consultancy Ltd. 2014
set serveroutput on echo on
DECLARE 
  l_pm_instance_id_m4 INTEGER;
  l_fetch_count INTEGER;
  l_exec_count INTEGER;
BEGIN /*now remove PeopleTools SQL transaction and any children and adjust trans durations*/
  FOR i IN (
    WITH x AS ( /*returns PeopleTools tables as defined in Object security*/
      SELECT o.entname recname
      FROM   psobjgroup o
      WHERE  o.objgroupid = 'PEOPLETOOLS'
      AND    o.enttype = 'R'
    )
    SELECT h.pm_instance_id, h.pm_parent_inst_id, h.pm_trans_duration, h.pm_trans_defn_id
    FROM   pspmtranshist h
           LEFT OUTER JOIN x
           ON h.pm_metric_value7 LIKE 'SELECT '||x.recname||'%'
           AND x.recname = upper(regexp_substr(pm_metric_value7,'[^ ,]+',8,1)) /*first word after select*/
    WHERE  pm_perf_trace like 'xPT%' /*restrict to cloned traces*/
--  AND    pm_perf_trace = 'xPT9b. XXXXXXXXXX' /*work on a specific trace*/
    AND    pm_instance_id < 1E16 /*restrict to cloned traces*/
    AND   (   x.recname IS NOT NULL 
           OR h.pm_trans_defn_id IN(425 /*Implicit Commit*/))
    ORDER BY pm_instance_id DESC
  ) LOOP
    l_pm_instance_id_m4 := TO_NUMBER(NULL);
 
    IF i.pm_parent_inst_id>0 AND i.pm_trans_duration>0 THEN
      FOR j IN(
        SELECT  h.pm_instance_id, h.pm_parent_inst_id, h.pm_top_inst_id, h.pm_trans_defn_id
        ,       d.pm_metricid_3, d.pm_metricid_4
        FROM    pspmtranshist h
          INNER JOIN pspmtransdefn d
          ON         d.pm_trans_defn_set = h.pm_trans_defn_set
          AND        d.pm_trans_defn_id = h.pm_trans_Defn_id
        START WITH h.pm_instance_id = i.pm_parent_inst_id
        CONNECT BY prior h.pm_parent_inst_id = h.pm_instance_id 
      ) LOOP
        /*decrement parent transaction times*/
        IF j.pm_metricid_4 = 66 /*PeopleTools SQL Time (ms)*/ THEN --decrement metric 4 on transaction 400
          --dbms_output.put_line('ID:'||i.pm_instance_id||' Type:'||i.pm_trans_defn_id||' decrement metric_value4 by '||i.pm_trans_duration);
          UPDATE pspmtranshist 
          SET    pm_metric_value4 = pm_metric_value4 - i.pm_trans_duration
          WHERE  pm_instance_id = j.pm_instance_id
          AND    pm_trans_Defn_id = j.pm_trans_defn_id
          AND    pm_metric_value4 >= i.pm_trans_duration
          RETURNING pm_instance_id INTO l_pm_instance_id_m4;
        ELSIF j.pm_metricid_3 = 66 /*PeopleTools SQL Time (ms)*/ THEN --SQL time on serialisation
          --dbms_output.put_line('ID:'||i.pm_instance_id||' Type:'||i.pm_trans_defn_id||' decrement metric_value3 by '||i.pm_trans_duration);
          UPDATE pspmtranshist 
          SET    pm_metric_value3 = pm_metric_value3 - i.pm_trans_duration
          WHERE  pm_instance_id = j.pm_instance_id
          AND    pm_trans_Defn_id = j.pm_trans_defn_id
          AND    pm_metric_value3 >= i.pm_trans_duration;
        END IF;

        UPDATE pspmtranshist 
        SET    pm_trans_duration = pm_trans_duration - i.pm_trans_duration
        WHERE  pm_instance_id = j.pm_instance_id
        AND    pm_trans_duration >= i.pm_trans_duration;
      END LOOP;
    END IF;

    l_fetch_count := 0;
    l_exec_count := 0;
    FOR j IN( /*identify transaction to be deleted and any children*/
      SELECT  pm_instance_id, pm_parent_inst_id, pm_top_inst_id, pm_trans_defn_id, pm_metric_value3
      FROM    pspmtranshist
      START WITH pm_instance_id = i.pm_instance_id
      CONNECT BY PRIOR pm_instance_id = pm_parent_inst_id 
    ) LOOP
      IF j.pm_trans_defn_id = 408 THEN /*if PeopleTools SQL*/
        l_exec_count := l_exec_count + 1;
      ELSIF j.pm_trans_defn_id = 414 THEN /*if PeopleTools SQL Fetch*/
        l_fetch_count := l_fetch_count + j.pm_metric_value3;
      END IF;
      DELETE FROM pspmtranshist h /*delete tools transaction*/
      WHERE h.pm_instance_id = j.pm_instance_id;
   END LOOP;

   IF l_pm_instance_id_m4 > 0 THEN 
     --dbms_output.put_line('ID:'||l_pm_instance_id_m4||' Decrement '||l_exec_Count||' executions, '||l_fetch_count||' fetches');
     UPDATE pspmtranshist  
     SET    pm_metric_value5 = pm_metric_value5 - l_exec_count
     ,      pm_metric_value6 = pm_metric_value6 - l_fetch_count
     WHERE  pm_instance_id = l_pm_instance_id_m4;
    l_fetch_count := 0;
    l_exec_count := 0;
   END IF;

  END LOOP;
END;
/
Now, I have a second PPM trace that I can open in the analytic component.
Figure 4: Original and Cloned PPM traces


When I open the cloned trace, both timings in the duration summary have reduced as have the number of executions and fetches.  The durations of the individual server round trips have also reduced.
Figure 5: Component Trace without PeopleTools transactions

All of the PeopleTools SQL operations have disappeared from the SQL summary.
Figure 6: SQL Summary of PPM trace after removing PeopleTools SQL transactions

The SQL summary now only has 125 rows of data.
Figure 7: SQL Summary of PMU without PeopleTools SQL

Now, the PPM tree component opens quickly and without error.
Figure 8: PMU Tree after removing PeopleTools SQL

There may still be more transactions in a PMU than I can show in a screenshot, but I can now find the statement that took the most time quite quickly.

Figure 9: Long SQL transaction further down same PMU tree

Conclusions 

I think that it is reasonable and useful to remove PeopleTools SQL operations from a PPM trace.
In normal production operation, components will mostly be cached, and this approach renders traces collected in non-production environments both usable in the PPM analytic components and more realistic for performance tuning. However, it is essential that when deleting some transactions from a PMU, that summary data held in other transactions in the same PMU are also corrected so that the metrics remain consistent.

Friday, October 24, 2014

Minimising Parse Time in Application Engine with ReUseStatement

This article explains how to determine the overhead of using literal values rather than bind variables in SQL submitted by PeopleSoft Application Engine programs. Using a combination of PeopleSoft Application Engine Batch Timings and Oracle Active Session History (ASH), it is possible to determine where it is most effective to change to alter this behaviour by setting the ReUse attribute.

ReUse Statement Flag

I originally wrote about the Performance Benefits of ReUseStatement in Application Engine over 5 years ago, and the problem is no less significant today than it was then.  There are still many places in the delivered PeopleSoft application that would benefit from it.  However, it is not possible to simply set the attribute across all Application Engine programs because it will cause errors in steps where SQL is dynamically generated, so each case must be considered.  Where the ReUse attributed is changed, it must be tested and migrated like any other customisation.

Recently, I have been encountering problems in a number of places on a Financials system which were resolved by enabling ReUseStatement.  So I started by calculating how much time was lost by not setting it.

Application Engine Batch Timings

If an Application Engine step is not reused, then it is compiled prior to every execution during which the Application Engine bind variables are resolved to literals. The number and duration of compilations and executions are reported in the Batch Timings, the production of which are controlled with the TraceAE flag in the Process Scheduler configuration file (psprcs.cfg).  

;-------------------------------------------------------------------------
; AE Tracing Bitfield
;
; Bit       Type of tracing
; ---       ---------------
...
; 128       - Timings Report to AET file
...
; 1024      - Timings Report to tables
...
TraceAE=1152
;------------------------------------------------------------------------

Whatever other TraceAE flags you set, I would always recommend that you set 128 and 1024 so that batch timings are always emitted to both file and database.  The overhead of enabling them is negligible because they are managed in memory at run time and physically written once when the Application Engine program ends.

NB: The settings in the configuration file can be overridden by command line options.  If you specify -TRACE parameter in the Process Scheduler definitions remember to also set these flags.

Batch timings are written to the AE Trace file at end of an Application Engine program, and to PS_BAT_TIMINGS PeopleTools tables at the successful end of an Application Engine program. 
It can be useful to have batch timings in the trace file of an Application Engine that failed because they are not written to the database.  As your system runs, you will build up batch timings for all of your successful Application Engine processes (which will be most of them.  This is a useful source of performance metrics.

Compilations, Execution and ReUse

In this example, the number of compilations is equal to the number of executions because ReUseStatement is not set.

                          PeopleSoft Application Engine Timings
                              (All timings in seconds)

                               C o m p i l e    E x e c u t e    F e t c h        Total
SQL Statement                  Count   Time     Count   Time     Count   Time     Time
------------------------------ ------- -------- ------- -------- ------- -------- --------
99XxxXxx.Step02.S                 8453      2.8    8453    685.6       0      0.0    688.4
...

With ReUse Statement enabled, there is now only a single compilation, and most of the time is saved in execution not compilation.

                               C o m p i l e    E x e c u t e    F e t c h        Total
SQL Statement                  Count   Time     Count   Time     Count   Time     Time
------------------------------ ------- -------- ------- -------- ------- -------- --------
99XxxXxx.Step02.S                    1      0.0    8453    342.3       0      0.0    342.3
...

So we can use the batch timings to identify steps where ReUseStatement is not set because they have as many compilations as executions, and then we can profile the top statements.

 Profile Compilations

This query produces a simple profile of batch timings for statements. 
  • In sub-query x it extract batch timings for statements with more than one compilation in processes that ended in the last 7 days.
  • There is a long-standing bug in batch timings where negative timings can be returned when the clock that returns milliseconds recycles back to zero every 216 milliseconds.  Sub-query y calculates an adjustment that is applied in sub-query z if the timing is negative.
  • Arbitrarily, I am only looking at statements with more than a total of 10000 compilations.

REM ReUseCand.sql
REM (c)Go-Faster COnsultancy Ltd. 2014
COLUMN detail_id FORMAT a32
COLUMN step_time FORMAT 999990 HEADING 'AE|Step|Secs'
COLUMN compile_count HEADING 'AE|Compile|Count'
COLUMN execute_count HEADING 'AE|Execute|Count'
COLUMN processes HEADING 'Num|Process|Instances'
COLUMN process_name HEADING 'Process|Name'
SPOOL ReUseCand
WITH x AS (
SELECT  l.process_instance, l.process_name
,  l.time_elapsed/1000 time_elapsed
, l.enddttm-l.begindttm diffdttm
,  d.bat_program_name||'.'||d.detail_id detail_id
, d.compile_count, d.compile_time/1000 compile_time
, d.execute_time/1000 execute_time
FROM ps_bat_Timings_dtl d
, ps_bat_timings_log l
WHERE d.process_instance = l.process_instance
AND d.compile_count = d.execute_count 
AND d.compile_count > 1 
AND l.enddttm > SYSDATE-7
), y as (
SELECT  x.*
, GREATEST(0,60*(60*(24*EXTRACT(day FROM diffdttm)
                             +EXTRACT(hour FROM diffdttm))
                             +EXTRACT(minute FROM diffdttm))
                             +EXTRACT(second FROM diffdttm)-x.time_elapsed) delta 
FROM  x)
, z as (
SELECT process_instance, process_name, detail_id
,  CASE WHEN time_elapsed < 0 THEN time_elapsed+delta  
               ELSE time_elapsed END time_elapsed
,  compile_count
, CASE WHEN compile_time < 0 THEN compile_time+delta
      ELSE compile_time END AS compile_time
, CASE WHEN execute_time < 0 THEN execute_time+delta
      ELSE execute_time END AS execute_time
FROM y
), a as (
SELECT  process_name, detail_id
, SUM(compile_time+execute_time) step_time
, SUM(compile_count) compile_count
, COUNT(DISTINCT process_instance) processes
FROM  z
GROUP BY process_name, detail_id)
SELECT * FROM a
WHERE compile_count >= 10000 
ORDER BY step_time DESC
/
SPOOL OFF

So now I have a list of steps with lots of compilations.  I know how long they took, but I don't know how much time I might save by enabling ReUseStatement. That will save some time in Application Engine, but it will also cut down database parse time.  So now I need determine the parse time from ASH data.

Process                                         Step    Compile    Process
Name         DETAIL_ID                          SEcs      Count  Instances
------------ -------------------------------- ------ ---------- ----------
AP_PSTVCHR   AP_PSTCOMMON.ACCT_UPD.Step02.S    12001      40704         10
AP_VCHRBLD   APVEDTMOVE.UPDQTY03.Step03.S       4313      49536         28
FS_VATUPDFS  FS_VATUPDFS.Seq0-b.DJ300-2.S       4057     203704          3
AP_VCHRBLD   APVEDTMOVE.UPDQTY03.Step02.S       2799      49536         28
PC_BI_TO_PC  PC_BI_TO_PC.UPD_PRBI.UPDATE.S      1974      23132         10
FS_VATUPDFS  FS_VATUPDFS.Seq0-a.X0001.D         1960      37368          3
GL_JEDIT_0   FS_CEDT_ECFS.iTSELog.iTSELog.S     1628      13104        519
AP_APY2015   AP_APY2015.V_CREATE.Step14.H       1192      11318         19

This query is based on the previous one, but includes scalar queries on the ASH data for each step.
  • WARNING: This query can run for a long period because it has to scan ASH data for each entry in BAT_TIMINGS_DTL.
  • This time in sub-query x I am looking for a rolling 7-day period up to the last hour, because ASH data will have been flushed to the ASH repository.
  • In sub-query y there are two scalar queries that retrieve the DB time spent on hard parse, and all DB time for each batch timing entry.  These queries count 10 seconds for each distinct sample ID to estimate elapsed time rather than total DB time.
  • The query does not group by process name because one step can be called from many Application Engine programs and I want to aggregate the total time across all of them.

REM ReUseCandASH.sql
REM (c)Go-Faster Consultancy Ltd. 2014
COLUMN processes       HEADING 'Num|Process|Instances'
COLUMN process_name    HEADING 'Process|Name'
COLUMN detail_id       FORMAT a32
COLUMN step_time       HEADING 'AE|Step|SEcs'    FORMAT 999990 
COLUMN compile_count   HEADING 'AE|Compile|Count'
COLUMN execute_count   HEADING 'AE|Execute|Count'
COLUMN hard_parse_secs HEADING 'Hard|Parse|Secs' FORMAT 99990
COLUMN ash_secs        HEADING 'DB|Time'         FORMAT 99990
SPOOL ReUseCandASH
WITH x AS (
SELECT  l.process_instance, l.process_name
,  l.time_elapsed/1000 time_elapsed
, l.begindttm, l.enddttm
, l.enddttm-l.begindttm diffdttm
,  d.bat_program_name||'.'||d.detail_id detail_id
, d.compile_count, d.compile_time/1000 compile_time
, d.execute_time/1000 execute_time
FROM ps_bat_timings_dtl d
, ps_bat_timings_log l
WHERE d.process_instance = l.process_instance
AND d.compile_count = d.execute_count
AND d.compile_count > 1
AND l.enddttm >= TRUNC(SYSDATE-7,'HH24')
AND l.enddttm < TRUNC(SYSDATE,'HH24') 
), y as (
SELECT  x.*
, GREATEST(0,60*(60*(24*EXTRACT(day    FROM diffdttm)
                             +EXTRACT(hour   FROM diffdttm))
                             +EXTRACT(minute FROM diffdttm))
                             +EXTRACT(second FROM diffdttm)-x.time_Elapsed) delta
FROM  x)
, z as  (
SELECT process_instance, process_name, detail_id
,  CASE WHEN time_elapsed < 0 THEN time_elapsed+delta 
             ELSE time_elapsed END AS time_elapsed
,  compile_count
, CASE WHEN compile_time < 0 THEN compile_time+delta
      ELSE compile_time END AS compile_time
, CASE WHEN execute_time < 0 THEN execute_time+delta
      ELSE execute_time END AS execute_time
, (
 SELECT 10*COUNT(DISTINCT h.sample_id) 
 FROM psprcsque q
 , dba_hist_snapshot x
  , dba_hist_active_sess_history h
 WHERE q.prcsinstance = y.process_instance
  AND  x.begin_interval_time <= y.enddttm
  AND  X.END_INTERVAL_TIME >= y.begindttm
  AND  h.sample_time between y.begindttm and y.enddttm
  AND  h.SNAP_id = x.SNAP_id
  AND  h.dbid = x.dbid
  AND  h.instance_number = x.instance_number
  AND  h.module = 'PSAE.'|| y.process_name||'.'||q.sessionidnum
  AND  h.action = y.detail_id
 AND h.in_hard_parse = 'Y'
 ) hard_parse_secs
, (
 SELECT 10*COUNT(DISTINCT h.sample_id)
 FROM psprcsque q
 , dba_hist_snapshot x
  , dba_hist_active_sess_history h
 WHERE q.prcsinstance = y.process_instance
  AND  x.begin_interval_time <= y.enddttm
  AND  X.END_INTERVAL_TIME >= y.begindttm
  AND  h.sample_time between y.begindttm and y.enddttm
  AND  h.SNAP_id = X.SNAP_id
  AND  h.dbid = x.dbid
  AND  h.instance_number = x.instance_number
  AND  h.module = 'PSAE.'|| y.process_name||'.'||q.sessionidnum
  AND  h.action = y.detail_id
 ) ash_secs
FROM  y
), a AS (
SELECT  /*process_name ,*/ detail_id
, SUM(compile_time+execute_time) step_time
, SUM(compile_count) compile_count
, COUNT(DISTINCT process_instance) processes
, SUM(hard_parse_secs) hard_parse_secs
, SUM(ash_secs) ash_secs
FROM  z
GROUP BY /*process_name,*/ detail_id)
SELECT  a.* 
FROM  a
WHERE  compile_count >= 10000
ORDER BY step_time DESC
/
spool off

Now we can also see how much time the database is spending on hard parse on each step, and it is this time that is likely to be saved by enabling ReUseStatement.
However, before we can enable the ReUseStatement attribute we must first manually inspect each step in Application Designer and determine whether doing so would break anything.  The Comment column in this profile was added manually as I did that.  Some statements I can change, some I have to accept the overhead.

                                   Step    Compile    Process      Parse         DB
DETAIL_ID                          Secs      Count  Instances       Secs       Time Comment
-------------------------------- ------ ---------- ---------- ---------- ---------- …………………………………………………………………………………………………………………………………
AP_PSTCOMMON.ACCT_UPD.Step02.S    12001      40704         10      11820      11920 Set ReUseStatement
FS_CEDT_ECMB.4EditCDT.uValCDT.S    5531      10289        679        620       5870 Dynamic SQL, can't set ReUseStatement
APVEDTMOVE.UPDQTY03.Step03.S       4306      49471         27       4020       4100 Set ReUseStatement
FS_VATUPDFS.Seq0-b.DJ300-2.S       4057     203704          3       3150       3860 Dynamic SQL, can't set ReUseStatement
FS_CEDT_ECFS.iTSELog.iTSELog.S     3332      19073        716       2130       3520 Dynamic SQL, can't set ReUseStatement
APVEDTMOVE.UPDQTY03.Step02.S       2796      49471         27       2730       2820 Set ReUseStatement
PC_BI_TO_PC.UPD_PRBI.UPDATE.S      1974      23132         10        230       1920 Set ReUseStatement 
FS_VATUPDFS.Seq0-a.X0001.D         1960      37368          3          0          0 Dynamic SQL, can't set ReUseStatement
FS_CEDT_ECMB.4uAnchCT.uAnchCDT.S   1319      10289        679        510       1290 Dynamic SQL, can't set ReUseStatement
AP_APY2015.V_CREATE.Step14.H       1169      11094         19          0          0 Set ReUseStatement
GL_JETSE.GA100.CHKEDT.S            1121      15776        569        860        930 Dynamic SQL, can't set ReUseStatement
FS_CEDT_ECMB.iTSELog.iTSELog.S      988      10289        679        450        990 Dynamic SQL, can't set ReUseStatement
FS_CEDT_ECMB.uMarkVal.uMarkVal.S    711      10289        679         50        670 Dynamic SQL, can't set ReUseStatement
FS_CEDT_ECMB.uMarkInv.uMarkInv.S    668      10289        679         40        790 Dynamic SQL, can't set ReUseStatement
  • Due to a bug in the instrumentation of Application Engine, the session's action attribute is not set for Do Select (type D) and Do When (type H) steps.  ASH data cannot therefore be matched for them.
  • More DB Time is reported for FS_CEDT_ECMB.uMarkInv.uMarkInv.S than is reported by batch timings.  This is a consequence of ASH sampling, where we count 10 seconds for each sample.

Conclusion

Setting ReUseStatement is very simple because it doesn't involve changing SQL, but there are lots of places where it could be set.  This technique picks out the relatively few places where doing so could potentially have a significant effect.

Wednesday, September 03, 2014

Who is using this index?

Or, to put it another way, I want to change or drop this index, who and what will I impact?

The Challenge 

The problem that I am going to outline is certainly not exclusive to PeopleSoft, but I am going to illustrate it with examples from PeopleSoft. I often find tables with far more indexes than are good for them.
  • The Application Designer tool makes it very easy for developers to add indexes to tables. Sometimes, too easy!
  • Sometimes, DBAs are too quick to unquestioningly follow the advice of the Oracle tuning advisor to add indexes.
Recently, I have been working on 3 different PeopleSoft Financials systems where I have found major tables with a host of indexes.

There are several concerns:
  • Indexes are maintained during data modification. The more indexes you have, the greater the overhead. 
  • The more indexes you have, particularly if they lead on the same columns, the more likely Oracle is to use the wrong one, resulting in poorer performance.
  • There is of course also a space overhead for each index, but this is often of less concern. 
If you can get rid of an index, Oracle doesn't store, maintain or use it. 

In some cases, I have wanted to remove unnecessary indexes, and in others to adjust indexes. However, this immediately raises the question of where are these indexes used, and who will be impacted by the change. Naturally, I turn to the Active Session History (ASH) to help me find the answers. 

Index Maintenance Overhead during DDL 

ASH reports the object number, file number, block number, and (from 11g) row number within the block being accessed by physical file operations. However, the values reported in v$active_session_history (and later other views) are not reliable for other events because they are merely left over from the previous file event that reported them. So, we can profile the amount of time spent on physical I/O on different tables and indexes, but not for other forms of DB Time, such as CPU time, spent accessing the blocks in the buffer cache.

Let me take an extreme example from PeopleSoft Global Payroll. The table PS_GP_RSLT_ACUM is one of the principal result tables. It has only a single unique index (with the same name). The table is populated with the simplest of insert statements.
INSERT /*GPPRDMGR_I_ACUM*/ INTO PS_GP_RSLT_ACUM
(CAL_RUN_ID ,EMPLID ,EMPL_RCD ,GP_PAYGROUP ,CAL_ID ,RSLT_SEG_NUM ,PIN_NUM ,EMPL_RCD_ACUM ,ACM_FROM_DT ,ACM_THRU_DT ,USER_KEY1 ,USER_KEY2 ,USER_KEY3 ,USER_KEY4 ,USER_KEY5 ,USER_KEY6 ,SLICE_BGN_DT ,SLICE_END_DT ,COUNTRY ,ACM_TYPE ,ACM_PRD_OPTN ,CALC_RSLT_VAL ,CALC_VAL ,USER_ADJ_VAL ,PIN_PARENT_NUM ,CORR_RTO_IND ,ORIG_CAL_RUN_ID ,SEQ_NUM8 ,VALID_IN_SEG_IND ,CALLED_IN_SEG_IND )
VALUES
(:1,:2,:3,:4,:5,:6,:7,:8,:9,:10,:11,:12,:13,:14,:15,:16,:17,:18,:19,:20,:21,:22,:23,:24,:25,:26,:27,:28,:29,:30)
I can profile the ASH data for just this statement over the last week on a production system. Note that DBA_OBJECTS and DBA_DATA_FILES are outer joined to the ASH data and only matched for events like 'db file%'
SELECT o.object_type, o.object_name
,      f.tablespace_name, NVL(h.event,'CPU+CPU Wait') event
,      SUM(10) ash_Secs
FROM dba_hist_Active_sess_history h
  LEFT OUTER JOIN dba_objects o
    ON o.object_id = h.current_obj#
   AND h.event like 'db file%'
  LEFT OUTER JOIN dba_data_files f
    ON f.file_id = h.current_file#
   AND h.event like 'db file%'
WHERE h.sql_id = '4ru0618dswz3y'
AND   h.sample_time >= sysdate-7
GROUP BY o.object_type, o.object_name, h.event, f.tablespace_name
ORDER BY ash_secs DESC
/
A full payroll calculation inserts over 3 million rows on this particular system. The calculation is run incrementally several times per week during which old rows are deleted and newly recalculated rows inserted.  Looking at just this insert statement:
  • 30% of the time is spent on CPU operations, we cannot profile that time further with ASH.
  • 38% of the time is spent reading from the table and index, yet this is a simple INSERT … VALUES statement.
OBJECT_TYPE         OBJECT_NAME        TABLESPACE_NAME EVENT                      ASH_SECS
------------------- ------------------ --------------- ------------------------ ----------
                                                       CPU+CPU Wait                   1040
                                       UNDOTBS1        db file sequential read         900
INDEX SUBPARTITION  PS_GP_RSLT_ACUM    GP201408IDX     db file sequential read         750
TABLE SUBPARTITION  PS_GP_RSLT_ACUM    GP201408TAB     db file sequential read         550
                                                       gc current grant 2-way           70
                                                       cursor: pin S wait on X          60
                                                       db file sequential read          10
                                                       buffer exterminate               10
                                                       row cache lock                   10
                                                                                ----------
                                                                                      3400 
More time is spent reading the index than the table.  That is not a surprise.  When you insert a row into a table, you also insert it into the index. Rows in index leaf blocks are ordered by the key columns, and the new entry must go into the right place, so you have to read down the index from the root block, through the branch blocks, to find the correct leaf block for the new entry.
[Digression: Counter-intuitively index compression can improve DML performance. It does for this index.  The overhead of the compression processing can be outweighed by the savings in physical I/O.  It depends.]

Profile Physical I/O by Object 

I can twist this query around and profile DB_TIME by object for 'db file%' events
SELECT o.object_type, o.object_name, sum(10) ash_secs
FROM   dba_hist_active_sess_history h
,      dba_objects o
WHERE  o.object_id = h.current_obj#
AND    h.event LIKE 'db file%'
AND    h.sample_time > sysdate-7
GROUP  BY o.object_type, o.object_name
ORDER BY ash_Secs DESC
Now I can see upon which objects the most time is spent on physical I/O.
OBJECT_TYP OBJECT_NAME          ASH_SECS
---------- ------------------ ----------
TABLE      PS_ITEM                101130
INDEX      PS_WS_ITEM              98750
TABLE      PS_PROJ_RESOURCE        97410
TABLE      PS_BI_LINE              85040
INDEX      PSAPSAPMSGSUBCON        75070
TABLE      PS_BI_HDR               37230
TABLE      PS_RS_ASSIGNMENT        29460
INDEX      PS_PSAPMSGPUBHDR        23230
INDEX      PS_BI_ACCT_ENTRY        21490
TABLE      PS_VOUCHER              21330
TABLE      PS_VCHR_ACCTG_LINE      21250
TABLE      PS_BI_ACCT_ENTRY        18860
…
                              ----------
sum                              1382680
This is a worthwhile exercise, it shows the sources of physical I/O in an application.

However, if you want to find where an index is used, then this query will also identify SQL_IDs where the index is either used in the query or maintained by DML. If I am interested in looking for places where changing or deleting an index could have an impact then I am only interested in SQL query activity. ASH samples that relate to index maintenance are a false positive. Yet, I cannot simply eliminate ASH samples where the SQL_OPNAME is not SELECT because the index may be used in a query within the DML statement.

Another problem with this method is that it matches SQL to ASH by object ID. If someone has rebuilt an index, then its object number changes.

A different approach is required.

Index Use from SQL Plans Captured by AWR 

During an AWR snapshot the top-n SQL statements by each SQL criteria in the AWR report (Elapsed Time, CPU Time, Parse Calls, Shareable Memory, Version Count) , see dbms_workload_repository. The SQL plans are exposed by the view DBA_HIST_SQL_PLAN.

On PeopleSoft systems, I generally recommend decreasing the snapshot interval from the default of 60 minutes to 15. The main reason is that SQL gets aged out of the library cache very quickly in PeopleSoft systems. They generate lots of dynamic code, often with literal values rather than bind variables. Cursor sharing is not recommended for PeopleSoft, so different bind variables result in different SQL_IDs. The dynamic code also results in different SQL IDs even with cursor sharing. Therefore, increasing the snapshot frequency means that will capture more SQL statements. This will increase the total volume of the AWR repository simply because there are more snapshots. However, the overall volume of ASH data captured does not change, it just gets copied to the repository earlier.

On DBA_HIST_SQL_PLAN the object ID, owner, type, and name are recorded, so I can find the plans which referenced a particular object. I am going to carry on with the example from a PeopleSoft Financials system and look at indexes on the PS_PROJ_RESOURCE table.

These are some of the indexes on PS_PROJ_RESOURCE. We have 4 indexes that all lead on PROCESS_INSTANCE. I suspect that not all are essential, but I need to work out what is using them, and which one I should retain.
                          Col
INDEX_NAME                Pos COLUMN_NAME          COLUMN_EXPRESSION
------------------ ---------- -------------------- ----------------------------------
…
PSJPROJ_RESOURCE            1 PROCESS_INSTANCE
                            2 BUSINESS_UNIT_GL
                            3 BUSINESS_UNIT
                            4 PROJECT_ID
                            5 ACTIVITY_ID
                            6 CUST_ID

PSLPROJ_RESOURCE            1 PROCESS_INSTANCE
                            2 EMPLID
                            3 EMPL_RCD
                            4 TRANS_DT

PSMPROJ_RESOURCE            1 PROCESS_INSTANCE
                            2 BUSINESS_UNIT
                            3 PROJECT_ID
                            4 ACTIVITY_ID
                            5 RESOURCE_ID

PSNPROJ_RESOURCE            1 PROCESS_INSTANCE
                            2 BUSINESS_UNIT
                            3 TIME_RPTG_CD
…
I find it easier to extract the ASH data to my own working storage table. For each index on PS_PROJ_RESOURCE, I am going to extract a distinct list of plan hash values. I will then extract all ASH data for those plans. Note, that I have not joined the SQL_ID on DBA_HIST_SQL_PLAN. That is because different SQL_IDs can produce the same execution plan. The plan is equally valid for all SQL_IDs that produce the plan, not just the one where the SQL_ID also matches.
DROP TABLE my_ash purge
/
CREATE TABLE my_ash COMPRESS AS
WITH p AS (
  SELECT DISTINCT p.plan_hash_value, p.object#, p.object_owner, p.object_type, p.object_name
  FROM      dba_hist_sql_plan p
  WHERE     p.object_name like 'PS_PROJ_RESOURCE'
 AND p.object_type LIKE 'INDEX%'
  AND p.object_owner = 'SYSADM'
 )
SELECT p.object# object_id, p.object_owner, p.object_type, p.object_name
,      h.*
FROM   dba_hist_active_sess_history h
,      p
WHERE  h.sql_plan_hash_value = p.plan_hash_value
/ 
I am fortunate that PeopleSoft is a well-instrumented application. Module and Action are set to fairly sensible values that will tell me the whereabouts in the application to which the ASH sample relates. In the following query, I have omitted any ASH data generated by SQL*Plus, Toad, or SQL Developer, and also any generated by Oracle processes to prevent statistics collection jobs from being included.
Set pages 999 lines 150 trimspool on
break on object_name skip 1 
compute sum of ash_secs on object_name
column ash_secs heading 'ASH|Secs' format 9999999
column module format a20
column action format a32
column object_name format a18
column max_sample_time format a19 heading 'Last|Sample'
column sql_plans heading 'SQL|Plans' format 9999
column sql_execs heading 'SQL|Execs' format 99999
WITH h AS (
  SELECT   object_name
  ,  CASE WHEN h.module IS NULL THEN REGEXP_SUBSTR(h.program,'[^.@]+',1,1)
                 WHEN h.module LIKE 'PSAE.%' THEN REGEXP_SUBSTR(h.module,'[^.]+',1,2)
                         ELSE REGEXP_SUBSTR(h.program,'[^.@]+',1,1)
   END as module
  ,  CASE WHEN h.action LIKE 'PI=%' THEN NULL
        ELSE h.action
                    END as action
  , CAST(sample_time AS DATE) sample_time
  ,  sql_id, sql_plan_hash_value, sql_exec_id
  FROM    my_ash h
)
SELECT  object_name, module, action
, sum(10) ash_secs
, COUNT(DISTINCT sql_plan_hash_value) sql_plans
, COUNT(DISTINCT sql_id||sql_plan_hash_value||sql_exec_id) sql_execs
, MAX(sample_time) max_sample_time
FROM     h
WHERE NOT LOWER(module) IN('oracle','toad','sqlplus','sqlplusw')
AND       NOT LOWER(module) LIKE 'sql%'
GROUP BY object_name, module, action
ORDER BY SUBSTR(object_name,4), object_name, ash_Secs desc
/
Spool off
I now have a profile of how much each index is used. In this particular case, I found something using every index.  It is possible that you will not find anything that uses some indexes.
                                                                             ASH   SQL    SQL Last
OBJECT_NAME        MODULE               ACTION                              Secs Plans  Execs Sample
------------------ -------------------- -------------------------------- ------- ----- ------ -------------------
…
PSJPROJ_RESOURCE   PC_TL_TO_PC          GFCPBINT_AE.CallmeA.Step24.S        7300     1     66 06:32:57 27/08/2014
                   PC_PRICING           GFCPBINT_AE.CallmeA.Step24.S          40     1      2 08:38:57 22/08/2014
******************                                                       -------
sum                                                                         7340

PSLPROJ_RESOURCE   PC_TL_TO_PC          GFCPBINT_AE.CallmeA.Step28.S        1220     1     53 06:33:17 27/08/2014
******************                                                       -------
sum                                                                         1220

PSMPROJ_RESOURCE   PC_TL_TO_PC          GFCPBINT_AE.XxBiEDM.Step07.S          60     2      6 18:35:18 20/08/2014
******************                                                       -------
sum                                                                           60

PSNPROJ_RESOURCE   PC_TL_TO_PC          GFCPBINT_AE.CallmeA.Step26.S        6720     1     49 18:53:58 26/08/2014
                   PC_TL_TO_PC          GFCPBINT_AE.CallmeA.Step30.S        3460     1     60 06:33:27 27/08/2014
                   GFCOA_CMSN           GFCOA_CMSN.01INIT.Step01.S          2660     1     47 19:19:40 26/08/2014
                   PC_TL_TO_PC          GFCPBINT_AE.CallmeA.Step06.S        1800     1     52 18:53:28 26/08/2014
                   PC_TL_TO_PC          GFCPBINT_AE.CallmeG.Step01.S        1740     1     61 06:34:17 27/08/2014
                   PC_TL_TO_PC          GFCPBINT_AE.CallmeA.Step02.S        1680     1     24 18:53:18 26/08/2014
                   PC_TL_TO_PC          GFCPBINT_AE.CallmeA.Step10.S        1460     1     33 17:26:26 22/08/2014
                   PC_TL_TO_PC          GFCPBINT_AE.CallmeA.Step08.S         920     1     26 17:26:16 22/08/2014
                   PC_TL_TO_PC          GFCPBINT_AE.CallmeA.Step36.S         460     1     18 18:26:38 20/08/2014
                   PC_TL_TO_PC          GFCPBINT_AE.CallmeA.Step09.S         420     1     16 06:33:07 27/08/2014
                   PC_PRICING           GFCPBINT_AE.CallmeG.Step01.S         200     1     10 08:09:55 22/08/2014
                   PC_AP_TO_PC          GFCPBINT_AE.CallmeH.Step00A.S        170     1     17 21:53:26 21/08/2014
                   PC_PRICING           GFCPBINT_AE.CallmeA.Step36.S          20     1      1 08:02:46 05/08/2014
                   PC_PRICING           GFCPBINT_AE.CallmeA.Step30.S          20     1      1 13:42:48 04/08/2014
                   PC_PRICING           GFCPBINT_AE.CallmeA.Step06.S          20     1      1 15:58:35 28/07/2014
                   PC_TL_TO_PC          GFCPBINT_AE.CallmeA.Pseudo.S          20     1      1 19:45:11 06/08/2014
******************                                                       -------
sum                                                                        21770
…
The next stage is to look at individual SQL statements This query looks for which SQL statement is using a particular index on PROJ_RESOURCE. If I can't find the SQL that cost the most time, then just choose another SQL with the same plan
  • I have found that sometimes a plan is captured by AWR, but the SQL statement is not. Personally, I think that is a bug. Working around it has made the following query quite complicated.
Break on object_name skip 1 
column ash_secs heading 'ASH|Secs' format 9999999
Set long 50000
Column cmd Format a200
Spool dmk

WITH h AS (
  SELECT  h.object_name
  ,       CASE WHEN h.module IS NULL THEN REGEXP_SUBSTR(h.program,'[^.@]+',1,1)
               WHEN h.module LIKE 'PSAE.%' THEN REGEXP_SUBSTR(h.module,'[^.]+',1,2)
               ELSE REGEXP_SUBSTR(h.program,'[^.@]+',1,1)
          END as module
  ,       CASE WHEN h.action LIKE 'PI=%' THEN NULL
               ELSE h.action
          END as action
  ,       h.sql_id, h.sql_plan_hash_value
  ,       t.command_type –-not null if plan and statement captured
  FROM    my_ash h
  LEFT OUTER JOIN (
    SELECT t1.*
    FROM dba_hist_sqltext t1
    ,    dba_hist_sql_plan p1
   WHERE t1.sql_id = p1.sql_id
    AND p1.id = 1
    ) t
  ON   t.sql_id = h.sql_id
   AND  t.dbid = h.dbid
  WHERE   h.object_name IN('PSMPROJ_RESOURCE')
  AND     h.object_Type = 'INDEX'
  AND     h.object_owner = 'SYSADM'
  And     NOT LOWER(module) IN('oracle','toad','sqlplus','sqlplusw')
  AND     NOT LOWER(module) LIKE 'sql%'
), x AS ( --aggregate DB time by object and statement
SELECT    object_name, sql_id, sql_plan_hash_value
, sum(10) ash_secs
,  10*COUNT(command_type) sql_secs  --DB time for captured statements only
FROM      h
WHERE NOT LOWER(module) IN('oracle','toad','sqlplus','sqlplusw')
AND       NOT LOWER(module) LIKE 'sql%'
GROUP BY  object_name, sql_id, sql_plan_hash_value
), y AS ( --rank DB time per object and plan
SELECT  object_name, sql_id, sql_plan_hash_value
,  ash_secs
, SUM(ash_secs) OVER (PARTITION BY object_name, sql_plan_hash_value) plan_ash_secs
, row_number() OVER (PARTITION BY object_name, sql_plan_hash_value ORDER BY sql_Secs DESC) ranking
FROM x
), z AS (
SELECT object_name
, CASE WHEN t.sql_text IS NOT NULL THEN y.sql_id
       ELSE (SELECT t1.sql_id
             FROM   dba_hist_sqltext t1
             ,      dba_hist_sql_plan p1
             WHERE  t1.sql_id = p1.sql_id
             AND    p1.plan_hash_value = y.sql_plan_hash_value
             AND    rownum = 1) --if still cannot find statement just pick any one
  END AS sql_id
, y.sql_plan_hash_value, y.plan_ash_secs
, CASE WHEN t.sql_text IS NOT NULL THEN t.sql_text 
       ELSE (SELECT t1.sql_Text
             FROM   dba_hist_sqltext t1
             ,      dba_hist_sql_plan p1
             WHERE  t1.sql_id = p1.sql_id
             AND    p1.plan_hash_value = y.sql_plan_hash_value
             AND    rownum = 1) --if still cannot find statement just pick any one
  END AS sql_text
from y
 left outer join dba_hist_sqltext t
 on t.sql_id = y.sql_id
WHERE ranking = 1 --captured statement with most time
)
SELECT *
--'SELECT * FROM table(dbms_xplan.display_awr('''||sql_id||''','||sql_plan_hash_value||',NULL,''ADVANCED''))/*'||object_name||':'||plan_ash_Secs||'*/;' cmd
FROM z
ORDER BY object_name, plan_ash_secs DESC
/
Spool off
So now I can see the individual SQL statements.
PSJPROJ_RESOURCE   f02k23bqj0xc4          3393167302          7340 UPDATE PS_PROJ_RESOURCE C SET (C.Operating_Unit, C.CHARTFIELD1, C.PRODUCT, C.CLA
                                                                   SS_FLD, C.CHARTFIELD2, C.VENDOR_ID, C.contract_num, C.contract_line_num, …

PSLPROJ_RESOURCE   2fz0gcb2774y0           821236869          1220 UPDATE ps_proj_resource p SET p.deptid = NVL (( SELECT j.deptid FROM ps_job j WH
                                                                   ERE j.emplid = p.emplid AND j.empl_rcd = p.empl_rcd AND j.effdt = ( SELECT MAX (…

PSMPROJ_RESOURCE   96cdkb7jyq863           338292674            50 UPDATE PS_GFCBI_EDM_TA04 a SET a.GFCni_amount = ( SELECT x.resource_amount FROM
                                                                   PS_PROJ_RESOURCE x WHERE x.process_instance = …

                   1kq9rfy8sb8d4          4135884683            10 UPDATE PS_GFCBI_EDM_TA04 a SET a.GFCni_amount = ( SELECT x.resource_amount FROM
                                                                   PS_PROJ_RESOURCE x WHERE x.process_instance = …

PSNPROJ_RESOURCE   ga2x2u4jw9p0x          2282068749          6760 UPDATE PS_PROJ_RESOURCE P SET (P.RESOURCE_TYPE, P.RESOURCE_SUB_CAT) = …

                   9z5qsq6wrr7zp          3665912247          3500 UPDATE PS_PROJ_RESOURCE P SET P.TIME_SHEET_ID = …
If I replace the last select clause with the commented line, then I can generate the commands to extract the statement and plan from the AWR repository.
SELECT * FROM table(dbms_xplan.display_awr('45ggt0yfrh5qp',3393167302,NULL,'ADVANCED'))/*PSJPROJ_RESOURCE:7340*/;

SELECT * FROM table(dbms_xplan.display_awr('8ntxj3694r6kg',821236869,NULL,'ADVANCED'))/*PSLPROJ_RESOURCE:1220*/;

SELECT * FROM table(dbms_xplan.display_awr('96cdkb7jyq863',338292674,NULL,'ADVANCED'))/*PSMPROJ_RESOURCE:50*/;

SELECT * FROM table(dbms_xplan.display_awr('1kq9rfy8sb8d4',4135884683,NULL,'ADVANCED'))/*PSMPROJ_RESOURCE:10*/;

SELECT * FROM table(dbms_xplan.display_awr('ga2x2u4jw9p0x',2282068749,NULL,'ADVANCED'))/*PSNPROJ_RESOURCE:6760*/;
SELECT * FROM table(dbms_xplan.display_awr('9z5qsq6wrr7zp',3665912247,NULL,'ADVANCED'))/*PSNPROJ_RESOURCE:3500*/;
SELECT * FROM table(dbms_xplan.display_awr('b28btd6k3x8jt',1288409804,NULL,'ADVANCED'))/*PSNPROJ_RESOURCE:3060*/;
SELECT * FROM table(dbms_xplan.display_awr('avs70c19khxmw',2276811880,NULL,'ADVANCED'))/*PSNPROJ_RESOURCE:2660*/;
SELECT * FROM table(dbms_xplan.display_awr('b78qhsch85g4a',1019599680,NULL,'ADVANCED'))/*PSNPROJ_RESOURCE:1960*/;
SELECT * FROM table(dbms_xplan.display_awr('65kq2v1ubybps',3138703971,NULL,'ADVANCED'))/*PSNPROJ_RESOURCE:1820*/;
SELECT * FROM table(dbms_xplan.display_awr('1dj17ra70c801',1175874548,NULL,'ADVANCED'))/*PSNPROJ_RESOURCE:1460*/;
SELECT * FROM table(dbms_xplan.display_awr('3w71v896s7m5d',3207074729,NULL,'ADVANCED'))/*PSNPROJ_RESOURCE:500*/;
SELECT * FROM table(dbms_xplan.display_awr('35mz5bw7p5ubw',2447377432,NULL,'ADVANCED'))/*PSNPROJ_RESOURCE:170*/;
Ultimately, I have needed to look through the SQL plans that use an index to decide whether I need to keep that index or decide whether the statement would perform adequately using another index. In this case, on this particular system, I think the index PSMPROJ_RESOURCE would be adequate for this statement, and I would consider dropping PSLPROJ_RESOURCE.
>SELECT * FROM table(dbms_xplan.display_awr('8ntxj3694r6kg',821236869,NULL,'ADVANCED'))/*PSLPROJ_RESOURCE:1220*/;
--------------------
UPDATE ps_proj_resource p SET p.deptid = NVL (( SELECT j.deptid FROM
ps_job j WHERE j.emplid = p.emplid AND j.empl_rcd = p.empl_rcd AND
j.effdt = ( SELECT MAX (j1.effdt) FROM ps_job j1 WHERE j1.emplid =
j.emplid AND j1.empl_rcd = j.empl_rcd AND j1.effdt <= p.trans_dt) AND
j.effseq = ( SELECT MAX (j2.effseq) FROM ps_job j2 WHERE j2.emplid =
j.emplid AND j2.empl_rcd = j.empl_rcd AND j2.effdt = j.effdt)),
p.deptid ) 
WHERE p.process_instance = … 
AND EXISTS ( SELECT
j.deptid FROM ps_job j WHERE j.emplid = p.emplid AND j.empl_rcd =
p.empl_rcd AND j.effdt = ( SELECT MAX (j1.effdt) FROM ps_job j1 WHERE
j1.emplid = j.emplid AND j1.empl_rcd = j.empl_rcd AND j1.effdt <=
p.trans_dt) AND j.effseq = ( SELECT MAX (j2.effseq) FROM ps_job j2
WHERE j2.emplid = j.emplid AND j2.empl_rcd = j.empl_rcd AND j2.effdt =
j.effdt))

Plan hash value: 821236869

-----------------------------------------------------------------------------------------
| Id  | Operation            | Name             | Rows  | Bytes | Cost (%CPU)| Time     |
-----------------------------------------------------------------------------------------
|   0 | UPDATE STATEMENT     |                  |       |       | 63104 (100)|          |
|   1 |  UPDATE              | PS_PROJ_RESOURCE |       |       |            |          |
|   2 |   INDEX RANGE SCAN   | PSLPROJ_RESOURCE |   365 | 11315 |    22   (0)| 00:00:01 |
|   3 |    INDEX RANGE SCAN  | PSAJOB           |     1 |    23 |     3   (0)| 00:00:01 |
|   4 |     SORT AGGREGATE   |                  |     1 |    20 |            |          |
|   5 |      INDEX RANGE SCAN| PSAJOB           |     1 |    20 |     3   (0)| 00:00:01 |
|   6 |     SORT AGGREGATE   |                  |     1 |    23 |            |          |
|   7 |      INDEX RANGE SCAN| PSAJOB           |     1 |    23 |     3   (0)| 00:00:01 |
|   8 |   INDEX RANGE SCAN   | PSAJOB           |     1 |    29 |     3   (0)| 00:00:01 |
|   9 |    SORT AGGREGATE    |                  |     1 |    20 |            |          |
|  10 |     INDEX RANGE SCAN | PSAJOB           |     1 |    20 |     3   (0)| 00:00:01 |
|  11 |    SORT AGGREGATE    |                  |     1 |    23 |            |          |
|  12 |     INDEX RANGE SCAN | PSAJOB           |     1 |    23 |     3   (0)| 00:00:01 |
-----------------------------------------------------------------------------------------
…
I carried on with the examination of SQL statements and execution plans to determine whether each index is really needed or another index (or even no index at all) would do as well.  This decision also requires some background knowledge about the application. Eventually, I decided that I want to drop the J, L, and N indexes on PROJ_RESOURCE and just keep M. 

Limitations of Method

AWR does not capture all SQLs, nor all SQL plans. First the SQL has to be in the library cache and then it must be one of the top-n. A SQL that is efficient because it uses an appropriate index may not be captured, and will not be detected by this approach. This might lead you to erronously believe that the index could be dropped.
ASH data is purged after a period of time, by default 31 days. If an index is only used by a process that has not run within the retention period, then it will not be detected by this approach. This is another reason to retain ASH and AWR in a repository for a longer period. I have heard 400 days suggested so that you have ASH for a year and a month.
  • However, this also causes the SYSAUX tablespace to become very large, so I would suggest regularly moving the data to a separate database. I know one customer who has built a central AWR repository for all their production and test databases and automated regular transfer of data. That repository has been of immense diagnostic value.
[Update] This analysis will not detect index use in support of constraint validation (PeopleSoft doesn't use database referential integrity constraints).  As Mark Farnham points out below, that may be a reason for retaining a particular index.

Getting Rid of Indexes 

Obviously, any index changes need to be tested carefully in all the places that reference the index, but on the other hand, it is not viable to do a full regression test every time you want to change an index.
Therefore, if all the testing is successful and you decide to go ahead and drop the index in production, you might prefer to make it invisible first for a while before actually dropping it. It is likely that the indexes you choose to examine are large and will take time to rebuild. An invisible index will not be used by the optimizer, but it will continue to be maintained during DML. If there are any unfortunate consequences, you can immediately make the index visible without having to rebuild it.