Tuesday, December 11, 2007

Changes in Calculation of Predicate Selectivity in Oracle 10g

Stuff changes! The very first entry I wrote for this blog back in April 2006 (http://blog.psftdba.com/2006/04/currentdatein-metasql-prevents-oracle.html) discussed how the Oracle 9i optimizer calculated the selectivity of expressions, such as the expansion of the %CurrentDateIn macro in PeopleSoft. Recently, I had cause to repeat the test script in this entry on Oracle 10gR2 (10.2.0.1.0 on Windows, 10.2.0.3.0 on HP-UX).
For the simple TRUNC(SYSDATE) predicate, Oracle correctly calculated the cardinality as 4. So no change here since Oracle 9i.
EXPLAIN PLAN FOR
SELECT * FROM t1 WHERE c > TRUNC(SYSDATE);

--------------------------------------------------------------------------
| Id  | Operation         | Name | Rows  | Bytes | Cost (%CPU)| Time     |
--------------------------------------------------------------------------
|   0 | SELECT STATEMENT  |      |     4 |  4096 |    41   (0)| 00:00:01 |
|*  1 |  TABLE ACCESS FULL| T1   |     4 |  4096 |    41   (0)| 00:00:01 |
--------------------------------------------------------------------------

Predicate Information (identified by operation id):
---------------------------------------------------

   1 - filter("C">TRUNC(SYSDATE@!))

But when I use the expansion of the PeopleSoft %CurrentDateIn macro, Oracle 10g now also correctly calculates the cardinality as 4. Oracle 9i didn't calculate this, and instead used a hard-coded assumption of 5% selectivity (50 rows in this example).
EXPLAIN PLAN FOR
SELECT * FROM t1 WHERE c > TO_DATE(TO_CHAR(SYSDATE,'YYYY-MM-DD'),'YYYY-MM-DD');

--------------------------------------------------------------------------
| Id  | Operation         | Name | Rows  | Bytes | Cost (%CPU)| Time     |
--------------------------------------------------------------------------
|   0 | SELECT STATEMENT  |      |     4 |  4096 |    41   (0)| 00:00:01 |
|*  1 |  TABLE ACCESS FULL| T1   |     4 |  4096 |    41   (0)| 00:00:01 |
--------------------------------------------------------------------------

Predicate Information (identified by operation id):
---------------------------------------------------

   1 - filter("C">TO_DATE(TO_CHAR(SYSDATE@!,'YYYY-MM-DD'),'YYYY-MM-DD'))

I have tried other more complex expressions, but it would appear that, where possible, Oracle will calculate the value of the expression and then use that result to calculate the selectivity of that value.
This statement will generate an error when it is executed because the divisor is zero. However, if I just produce an execution plan, Oracle cannot calculate the selectivity, and so has gone back to the 5% assumption.
EXPLAIN PLAN FOR
SELECT * FROM t1 WHERE c > TO_DATE(TO_CHAR(SYSDATE,'YYYY-MM-DD'),'YYYY-MM-DD');

--------------------------------------------------------------------------
| Id  | Operation         | Name | Rows  | Bytes | Cost (%CPU)| Time     |
--------------------------------------------------------------------------
|   0 | SELECT STATEMENT  |      |    50 | 51200 |    41   (0)| 00:00:01 |
|*  1 |  TABLE ACCESS FULL| T1   |    50 | 51200 |    41   (0)| 00:00:01 |
--------------------------------------------------------------------------

Predicate Information (identified by operation id):
---------------------------------------------------

   1 - filter("C">SYSDATE@!+1/0)

While it is wonderful that Oracle optimizer has got a bit cleverer in calculating the cardinality of predicates, this is going to cause execution plans to change on upgrading to 10g. Research into this is on-going, but I am particularly concerned by the effect on the costing of effective-dated sub-queries.

Saturday, November 03, 2007

Advantages of Row Source Aliases inside Views

Here is a simple idea that could make it easier to read the execution plan of queries that have multiple references to the same table, possibly via views: make the row source aliases sufficiently distinctive that they would identify the view. Perhaps even have the alias include the name of view.
This is not exclusive to PeopleSoft, except that PeopleSoft uses views very heavily.

First here is a very simple test example. I'll create a table and a view on the same table.
CREATE TABLE t
(a NUMBER NOT NULL CONSTRAINT t_pk PRIMARY KEY
,b NUMBER NOT NULL);

INSERT INTO t
SELECT rownum, 2*rownum
FROM   dba_objects
WHERE  rownum <= 100; 

CREATE OR REPLACE VIEW v AS 
SELECT v.a, v.b FROM t v 
WHERE  v.a <= 42;

Now lets look at an execution plan of a query that joins the views.
EXPLAIN PLAN FOR
SELECT t.a, v.b
FROM   t, v
WHERE  t.a = v.b
AND    t.b >= 24;

SELECT * FROM TABLE(dbms_xplan.display);

From just the execution plan it is impossible to tell which INDEX SCAN is from which view.
-------------------------------------------------------------------------------------
| Id  | Operation                    | Name | Rows  | Bytes | Cost (%CPU)| Time     |
-------------------------------------------------------------------------------------
|   0 | SELECT STATEMENT             |      |    42 |   420 |     3   (0)| 00:00:01 |
|   1 |  NESTED LOOPS                |      |    42 |   420 |     3   (0)| 00:00:01 |
|   2 |   TABLE ACCESS BY INDEX ROWID| T    |    42 |   210 |     2   (0)| 00:00:01 |
|*  3 |    INDEX RANGE SCAN          | T_PK |    42 |       |     1   (0)| 00:00:01 |
|*  4 |   TABLE ACCESS BY INDEX ROWID| T    |     1 |     5 |     1   (0)| 00:00:01 |
|*  5 |    INDEX UNIQUE SCAN         | T_PK |     1 |       |     0   (0)| 00:00:01 |
-------------------------------------------------------------------------------------

But the predicate information helps us. The nested loop is driven from the reference to T in the view V to the table T.
Predicate Information (identified by operation id):
---------------------------------------------------
  3 - access("V"."A"<=42)
  4 - filter("T"."B">=24)
  5 - access("T"."A"="V"."B")

The row source alias of the object appears in the predicate, but only if it is specified on that column in either the select list of the criteria. But now we can determine which operation relates to whivj reference.

Here is part of a simple SQL statement generated by nVIsion.
SELECT ...
FROM ps_pr_jrnl_hdr_vw a, ps_pr_jrnl_ln_vw b, 
     ps_xx_rt_rate_qvw c, ps_xx_rt_rate_q_vw d …;

Both PS_XX_RT_RATE_QVW and PS_XX_RT_RATE_Q_VW are views on PS_RT_RATE_TBL. We can see from the execution plan that Oracle has chosen to use one index in one view and another index in another. But which in which?
----------------------------------------------------------------------------------
| Id  | Operation                      |  Name           | Rows  | Bytes | Cost  |
----------------------------------------------------------------------------------
|   0 | SELECT STATEMENT               |                 |     1 |   160 |   549 |
|   1 |  SORT GROUP BY                 |                 |     1 |   160 |   549 |
|   2 |   NESTED LOOPS                 |                 |     1 |   160 |   547 |
|   3 |    NESTED LOOPS                |                 |     1 |   132 |   545 |
|*  4 |     HASH JOIN                  |                 |     1 |    66 |   541 |
|*  5 |      INDEX RANGE SCAN          | PSJJRNL_HEADER  |  4066 |   150K|    87 |
|*  6 |      INDEX FAST FULL SCAN      | PSFRT_RATE_TBL  |     1 |    28 |   452 |
|*  7 |     TABLE ACCESS BY INDEX ROWID| PS_JRNL_LN      |     1 |    66 |     4 |
|*  8 |      INDEX RANGE SCAN          | PSFJRNL_LN      |     1 |       |     3 |
|*  9 |    INDEX RANGE SCAN            | PSERT_RATE_TBL  |     1 |    28 |     2 |
----------------------------------------------------------------------------------

But I have used the name of the query as the row source alias for the table PS_RT_RATE_TBL in these views, and that alias now appears in the Predicate Information.
Predicate Information (identified by operation id):
---------------------------------------------------
…
  6 - filter(TO_NUMBER(TO_CHAR("XX_RT_RATE_QVW"."EFFDT",'YYYY'))=2007 AND ...
…
  9 - access("JL"."CURRENCY_CD"="XX_RT_RATE_Q_VW"."FROM_CUR" AND ...

So it now very obvious which view in the from clause is responsible for which access of the rate table at operations 6 and 9 in this plan.

Saturday, October 27, 2007

Record Locator Dialogue Behaviour

A little while ago I was asked whether Business Units need to be 5 characters for good performance. PeopleSoft used to recommend that SETIDs and Business Units should be defined as five characters.

I blithely responded that it was because if you put five characters into the search criteria of a five character field on a Record Locator Dialogue, then the resulting SQL would result in an equality condition rather than a LIKE.

If I search for a string shorter than the field, it generates a LIKE:

SELECT DISTINCT SETID ... WHERE SETID LIKE 'ABCD' || '%' ESCAPE '\' ...
ORDER BY SETID ...

If you search for a string equal in length to the field you get an equality (unless you specify something else in advanced search).

SELECT DISTINCT SETID ... WHERE SETID = 'ABCDE' ... ORDER BY SETID ...

That is how it was in PeopleTools 8.44, or at least that is what I wrote in my book (page 94).

But things change. I checking the behaviour in PeopleTools 8.48, and this is what I found:

Lets start with the Basic Search mode in the Record Locator Dialogue

The default operation in the basic search is 'begins with'. The search string is shorter than the field (11 characters in this case) and so we get a LIKE criteria, but there is a change here. The % has been put into the search string.

SELECT DISTINCT EMPLID, NAME, LAST_NAME_SRCH, SECOND_LAST_SRCH, NAME_AC
FROM PS_PERALL_SEC_SRCH
WHERE OPRID=:1 AND EMPLID LIKE '1%'
ORDER BY EMPLID
Bind-1 type=2 length=2 value=PS


However, if I fill the search field with 11 characters I still get a LIKE, and most significantly I no longer get an equality condition.

SELECT DISTINCT EMPLID, NAME, LAST_NAME_SRCH, SECOND_LAST_SRCH, NAME_AC
FROM PS_PERALL_SEC_SRCH
WHERE OPRID=:1 AND EMPLID LIKE '11111111111%'
ORDER BY EMPLID
Bind-1 type=2 length=2 value=PS


However, in Advanced Search, I get exactly what I ask for.
'Begins with' always results in a LIKE condition, irrespective of the length of the search string.

SELECT DISTINCT EMPLID, NAME, LAST_NAME_SRCH, SECOND_LAST_SRCH, NAME_AC
FROM PS_PERALL_SEC_SRCH
WHERE OPRID=:1 AND EMPLID LIKE '11111111111%'
ORDER BY EMPLID
Bind-1 type=2 length=2 value=PS


'Contains' always produces a LIKE condition, with % symbols at both ends, again irrespective of the length of the search string.

SELECT DISTINCT EMPLID, NAME, LAST_NAME_SRCH, SECOND_LAST_SRCH, NAME_AC
FROM PS_PERALL_SEC_SRCH
WHERE OPRID=:1 AND EMPLID LIKE '%11111111111%'
ORDER BY EMPLID
Bind-1 type=2 length=2 value=PS


If I specify '=', then I get an equality condition in the SQL, but the search criteria also becomes a bind variable in the SQL. This is different from all other cases, where the search criteria appears in the SQL as a literal value.

SELECT DISTINCT EMPLID, NAME, LAST_NAME_SRCH, SECOND_LAST_SRCH, NAME_AC
FROM PS_PERALL_SEC_SRCH
WHERE OPRID=:1 AND EMPLID=:2
ORDER BY EMPLID
Bind-1 type=2 length=2 value=PS
Bind-2 type=2 length=1 value=1


Only on a mixed case field, does PeopleSoft append the % in a separate string, because both the column and the search string are forced into upper case.

SELECT DISTINCT EMPLID, NAME, LAST_NAME_SRCH, SECOND_LAST_SRCH, NAME_AC
FROM PS_PERALL_SEC_SRCH
WHERE OPRID=:1
AND UPPER(NAME) LIKE UPPER('aaaaaaaaaaaaaaaaaaaaaaaaaaaaaaaaaaaaaaaaaaaaaaaaaa') || '%' ESCAPE '\'
ORDER BY NAME, EMPLID
Bind-1 type=2 length=2 value=PS


Implications

So does it matter that PeopleTools uses a LIKE instead of an equality? Sometimes it could, but not always. Here is a very simple test where I search for a single employee by the unique key columns, first with an equality
SELECT emplid FROM ps_personal_data WHERE emplid = 'SFCH00034'
/

--------------------------------------------------------------------------------------
| Id | Operation | Name | Rows | Bytes | Cost (%CPU)| Time |
--------------------------------------------------------------------------------------
| 0 | SELECT STATEMENT | | 1 | 8 | 1 (0)| 00:00:01 |
|* 1 | INDEX UNIQUE SCAN| PS_PERSONAL_DATA | 1 | 8 | 1 (0)| 00:00:01 |
--------------------------------------------------------------------------------------

Predicate Information (identified by operation id):
---------------------------------------------------
1 - access("EMPLID"='SFCH00034')

Statistics
----------------------------------------------------------
2 consistent gets

And here is the same search with a LIKE criteria
SELECT emplid FROM ps_personal_data WHERE emplid LIKE 'SFCH00034%'
/

-------------------------------------------------------------------------------------
| Id | Operation | Name | Rows | Bytes | Cost (%CPU)| Time |
-------------------------------------------------------------------------------------
| 0 | SELECT STATEMENT | | 1 | 8 | 2 (0)| 00:00:01 |
|* 1 | INDEX RANGE SCAN| PS_PERSONAL_DATA | 1 | 8 | 2 (0)| 00:00:01 |
-------------------------------------------------------------------------------------

Predicate Information (identified by operation id):
---------------------------------------------------
1 - access("EMPLID" LIKE 'SFCH00034%')
filter("EMPLID" LIKE 'SFCH00034%')

Statistics
----------------------------------------------------------
3 consistent gets

In this case, although both queries return the same result, it made the difference between a index unique scan and a single fetch operation, and an index range scan and a second fetch, requiring another consistent read. Although, I can also produce tests which produce the same execution plan and number of consistent reads for = and LIKE.
The LIKE operation does cause an additional filter operation, but this is only a small CPU overhead.

However, this does mean that the advice about having 5 character SETIDs and Business Units is no longer valid.

Tuesday, October 02, 2007

Dirty Reads in PeopleTools 8.49

In PeopleTools 8.49 you can configure the application server to use Dirty Reads on SQL Server and DB2/OS390. Let's start with a quick review of database isolation levels. If you run PeopleSoft on an Oracle database, you hardly ever have to worry about isolation levels, because Oracle defaults to Read Committed, where all transactions are transactionally or read consistent, and that doesn't bring any scalability problems. (In writing this note, I have spent a fair amount of time reading various Oracle and SQL Server websites. It has been an excellent revision!) What is read consistency? Well, if I start a long-running query at say 09.00, and then I update some data at 09.01 and commit that update, and then at 09.02 the query comes to the data that was changed at 09.01, it will report the data as at 09.00. So the set of data that is retrieved by the long-running query is consistent with itself. On Oracle, this is done by keeping information to reverse the change, essentially the old data values, in the undo (or rollback) segments from which it can construct, in memory, a read consistent version of data blocks as the start of the transaction. So at 9.02, Oracle creates a copy of the block in the buffer cache and uses the undo information to roll it back to the state it was in when the query began at 9.00, and then it reads the data from that read consistent copy. Thus, Oracle is capable of maintaining read consistency without locking, so that writers never block readers, and readers never block writers. Oracle also supports two other isolation levels:
  • Serializable: queries cannot see changes committed after the transaction began, but before the current query began.
  • Read-Only: as Serializable but no INSERT, UPDATE or DELETE statements are permitted.
Oracle has not explicitly implemented Repeatable Read as an isolation level, but the same effect can be achieved if you use SELECT ... FOR UPDATE. However, the other database platforms that are certified for PeopleSoft have additional isolation levels that can be set at database and session-level (and hence in the application). In SQL Server the isolation modes are:
  • Read Uncommitted (also known as Dirty Read): Queries simply read whatever is in the data blocks, so it is possible to read changes in the database that have not been committed and that may potentially be rolled back!
  • Read Committed (SQL Server default): Uncommitted changes cannot be read, queries can be blocked by shared locks created by updates unless using Read Committed Snapshot, or other transaction in higher isolation levels.
  • Read Committed Snapshot (available SQL Server 2005): row versioning is used to produce a transactionally consistent snapshot of the data. This is effectively equivalent to Read Committed on Oracle.
  • Repeatable Read: Locks are placed on all data that is read.
  • Serializable: Locks are placed on all data that is read, and rows cannot be inserted ranges of data queried by other statements.
  • Snapshot: Changes made after the start of the transaction cannot be seen.
PeopleSoft running on Microsoft SQL Server 2000 and Sybase has always had scalability problems with high concurrency because read consistency is achieved by the use of locking. This is addressed in SQL Server 2005 with the READ_COMMITTED_SNAPSHOT option, but this version of the database is not certified below PeopleTools 8.47.
Dirty Reads in PeopleTools 8.49 
Dirty-read mode can be specified for the application server:
[PSQRYSRV]
;=========================================================================
; Settings for PSQRYSRV
;=========================================================================
...
; Use dirty-read(uncommitted read) for PSQRYSRV only on DB2/OS390 or SQL Server
Use dirty-read=0
It can also be set for scheduled queries run by Application Engine in the Process Scheduler:
[PSAESRV]
...
;-----------------------------------------------------------------------------------------
; Setting to control dirty read for Scheduled PSQueries.
ScheduledQuery-DirtyRead = 0
This is what Enterprise PeopleTools 8.49 PeopleBook: System and Server Administration says:

"Use Dirty-Read: Enter 1 to enable the application server to read uncommitted data from a table. Enter 0 to disable dirty reads.

This parameter can be used for general reporting and PeopleSoft Query. You can run dirty read queries through the application server, the Process Scheduler, and in a two-tier connection. The Use Dirty-Read setting in the application server configuration controls the behaviour of PSAPPSRV, PSQCKSRV, and PSQRYSRV.

Note. Dirty reads are not recommended if you are reading data and doing subsequent processing based on the disposition of the data at the time that it is read. Between the time the data is read by a subsequent process and the time the unit of work is completed by the first process, any activity affecting the table data at the time a subsequent process read could be rolled back, invalidating the accuracy of the data that a subsequent process read." However, the parameter only appears in the query server section (PSQRYSRV) of the application server configuration file (psappsrv.cfg), so I suspect that it only applies to PS/Query queries (and therefore Crystal and BI Publisher reports) and nVision reports. Although, I haven't yet found confirmation of that in PeopleBooks or other documentation. The delivered comment in the configuration file says that dirty-reads apply to DB2/OS390 and SQL Server, but the documentation doesn't mention which databases it applies to. Dirty-reads do not occur in Oracle, but this isolation level is also available on Sybase and Informix. 
Conclusion You can get around the locking problems in SQL Server 2000 and DB2, but at a price. Your reports may not show you entirely accurate data! But, if you are running PeopleTools 8.49 on SQL Server 2000, I would question why you are not running SQL Server 2005.

Monday, October 01, 2007

PeopleTools 8.48: Descending Indexes are back!

In Application Designer, you can mark a key field as descending. When that record is used in a scroll on a page, PeopleTools automatically orders the query generated to populate the scroll in key order, and that includes specifying descending order for descending keys. The JOB record in HR is a good example.
On entering the JOB component, the PIA generates the SQL to retrieve the job history for a particular employee. The two known keys are specified in the where clause, but all the keys were used to generate the ORDER BY clause. EFFDT and EFFSEQ are descending keys on the JOB record, so the query is in descending order on those columns.

SELECT EMPLID,...
FROM PS_JOB
WHERE EMPLID=:1
AND EMPL_RCD=:2
ORDER BY EMPLID, EMPL_RCD, EFFDT DESC, EFFSEQ DESC

The descending key attribute has another purpose. Prior to PeopleTools 8.14, if you specified a key field as descending in Application Designer, that column would also be indexed in descending order where it appeared in indexes. However, PeopleSoft removed this functionality because of Oracle Bug 869177 which in most versions of Oracle 8.1 could cause ORA-3113 when accessing the index.

Now that Oracle has fixed the bug in the database, PeopleTools once again builds indexes with descending columns on Oracle RDBMS from PeopleTools 8.48.

However, as always, there is a snag (or I wouldn't have bothered to write this note). The name of the descending column is not reported in catalogue views. Instead the column name is replaced with a system generated column name.

SELECT table_name, index_name, column_position
,      column_name, descend
FROM   dba_ind_columns
WHERE  index_name = 'PS_JOB'

TABLE_NAME INDEX_NAME COLUMN_POSITION COLUMN_NAME  DESCEND
---------- ---------- --------------- ------------ ------------
PS_JOB     PS_JOB                   1 EMPLID       ASC
PS_JOB     PS_JOB                   2 EMPL_RCD     ASC
PS_JOB     PS_JOB                   3 SYS_NC00163$ DESC
PS_JOB     PS_JOB                   4 SYS_NC00164$ DESC

This could cause problems with SQL scripts that use the catalogue views. For example, I have had to change my DDL Trigger to protect database objects not managed by Application Designer.

So how do you find the name of the underlying column? You have to look in the sys owned catalogue tables. If you look at the query in $ORACLE_HOME/rdbms/admin/catalog.sql at the code behind the view, you find that the column names are stored on sys.col$. There is another column on that table called DEFAULT$, which stores the original column name.

COLUMN property        FORMAT 999999
COLUMN table_owner     FORMAT a8  HEADING 'Table|Owner'
COLUMN default$        FORMAT a8
COLUMN column_name     FORMAT a12 HEADING 'Column|Name'
COLUMN index_name      FORMAT a6  HEADING 'Index|Name'
COLUMN table_name      FORMAT a6  HEADING 'Table|Name'
COLUMN column_position FORMAT 99  HEADING 'Column|Position'
COLUMN column_length   FORMAT 999 HEADING 'Column|Length'
COLUMN char_length     FORMAT 999 HEADING 'Char|Length'
COLUMN descend         FORMAT a7

select /*i.obj#
,      io.name   index_owner
,      */idx.name  index_name
,      bo.name   table_owner
,      base.name table_name
,      decode(bitand(c.property, 1024), 1024,
(select decode(bitand(tc.property, 1), 1, ac.name, tc.name)
 from   sys.col$ tc, attrcol$ ac
 where  tc.intcol# = c.intcol#-1
   and  tc.obj# = c.obj#
   and  tc.obj# = ac.obj#(+
   and  tc.intcol# = ac.intcol#(+)),
decode(ac.name, null, c.name, ac.name)) column_name
,      c.property, c.default$
,      ic.pos#  column_position
,      c.length column_length
,      c.spare3 char_length
,      decode(bitand(c.property, 131072), 131072, 'DESC', 'ASC') descend
from sys.col$ c, sys.obj$ idx, sys.obj$ base, sys.icol$ ic,
sys.user$ io, sys.user$ bo, sys.ind$ i, sys.attrcol$ ac
where ic.bo# = c.obj#
and decode(bitand(i.property,1024),0,ic.intcol#,ic.spare2) = c.intcol#
and ic.bo# = base.obj#
and io.user# = idx.owner#
and bo.user# = base.owner#
and ic.obj# = idx.obj#
and idx.obj# = i.obj#
and i.type# in (1, 2, 3, 4, 6, 7, 9)
and c.obj# = ac.obj#(+)
and c.intcol# = ac.intcol#(+)
and io.name = 'SYSADM'
and idx.name = 'PS_JOB'
and bo.name = 'SYSADM'
and base.name = 'PS_JOB'
/

Index  Table    Table  Column                           Column Column   Char
Name   Owner    Name   Name         PROPERTY DEFAULT$ Position Length Length DESCEND
------ -------- ------ ------------ -------- -------- -------- ------ ------ -------
PS_JOB SYSADM   PS_JOB EMPLID              0                 1     11     11 ASC
PS_JOB SYSADM   PS_JOB EMPL_RCD            0                 2     22      0 ASC
PS_JOB SYSADM   PS_JOB SYS_NC00163$   196904 "EFFDT"         3     12      0 DESC
PS_JOB SYSADM   PS_JOB SYS_NC00164$   196904 "EFFSEQ"        4     34      0 DESC

My thanks to Noons for pointing out that you can get the underlying column or expression from DBA_IND_EXPRESSIONS.

Using v$session_longops to find long running SQL statements

v$session_longops is a dynamic performance view in which Oracle reports on the status of operations that run for more than 6 (elapsed) seconds. Various operations, including queries are automatically reported in this view. Applications can also mark operations as long running with DBMS_APPLICATION_INFO.SET_SESSION_LONGOPS.

I recently spent a day on a site (not a PeopleSoft system) watching a single update statement that eventually ran for 27 hours. I used this view to predict when the SQL statement would complete.

You can see incomplete long running operations by querying long operations where the work done so far is less than the total amount of work.

SELECT * FROM v$session_longops WHERE sofar < totalwork;

SID SERIAL# OPNAME
---------- ---------- -----------------------------------------------------------
TARGET
----------------------------------------------------------------
TARGET_DESC SOFAR TOTALWORK UNITS
-------------------------------- ---------- ---------- --------------------------
START_TIME LAST_UPDATE_TIME TIME_REMAINING ELAPSED_SECONDS CONTEXT
------------------- ------------------- -------------- --------------- ----------
MESSAGE
---------------------------------------------------------------------------------
USERNAME SQL_ADDRESS SQL_HASH_VALUE QCSID
------------------------------ ---------------- -------------- ----------
24 12722 Table Scan
R2LLMS.TBL_TMX_REGTRANSACTION
14407 24935 Blocks
01:25:40 28/09/2007 17:35:44 28/09/2007 42533 58204 0
Table Scan: R2LLMS.TBL_TMX_REGTRANSACTION: 14407 out of 24935 Blocks done
R2LLMS C00000012FE2A170 861482451 0

The operations remain in this view long after they have completed, so you can use it to get a feel for what long operations occur on a sytem. But there are a fixed number of slots for v$session_longops, determined by ksulomux_. The entry for a completed operation remains in the view until the slots is reused. They are not reused in order of allocation, instead the array element to be reused is "probably determined by a MOD function" (My thanks to Tanel Poder for his clarification). So v$session_longops contains both current incomplete long operations and an arbitrary sample of completed long operations.

You can use the SQL_ADDRESS and SQL_HASH_VALUE to get the SQL statement from the library cache.

SELECT l.sid, l.sofar, l.totalwork, l.start_time, l.last_update_time, s.sql_text
FROM v$session_longops l
LEFT OUTER JOIN v$sql s ON s.hash_value = l.sql_hash_value
AND s.address = l.sql_address
AND s.child_number = 0

SID SOFAR TOTALWORK START_TIME LAST_UPDATE_TIME
------ ---------- ---------- ------------------- -------------------
SQL_TEXT
--------------------------------------------------------------------
90 19014 26171 17:48:25 28/09/2007 17:48:37 28/09/2007
SELECT DISTINCT (PROCESSID) FROM PSAPMSGPUBHDR WHERE MACHINENAME=:1
AND PUBSTATUS IN (:"SYS_B_0", :"SYS_B_1") ORDER BY PROCESSID

Aggregate total amount of time spent on SQL statements. But there is a problem, SQL statements can produce multiple long operations that may or may not occur concurrently.

SELECT  l.sql_hash_value
, SUM(l.last_update_time-l.start_time)*86400 secs
, COUNT(*) execs
FROM v$session_longops l
GROUP BY l.sql_hash_value
ORDER BY secs

But what if the statement isn’t in the library cache we can try and get it out of statspack! This SQL function looks up the SQL statement by hash value and assembles the pieces up to 4000 characters

CREATE OR REPLACE FUNCTION perfstat.get_sqltext(p_hash_value NUMBER)
RETURN VARCHAR2 IS
l_sql_text VARCHAR2(32767) := '';
l_sql_left NUMBER := 4000;
BEGIN
FOR i IN(SELECT * FROM perfstat.stats$sqltext
WHERE hash_value = p_hash_value ORDER BY piece
) LOOP
IF l_sql_left > 64 THEN
l_sql_text := l_sql_text || i.sql_text;
ELSIF l_sql_left > 0 THEN
l_sql_text := l_sql_text || SUBSTR(i.sql_text,1,l_sql_left);
END IF;
l_sql_left := l_sql_left - LENGTH(i.sql_text);
END LOOP;
RETURN l_sql_text;
END get_sqltext;
/
show errors
GRANT EXECUTE ON perfstat.get_sqltext TO PUBLIC;

This version gets the SQL statement from library cache, and if it isn't there it looks it up from the statspack data.

spool longops
SELECT l.*, NVL(s.sql_text
, perfstat.get_sqltext(l.sql_hash_value)) sql_text
FROM (
SELECT l.target, l.operation, l.sql_hash_value
, SUM(secs) secs, SUM(execs) execs
FROM (
SELECT l.sid, l.serial#, l.sql_address, l.sql_hash_value
, l.target, l.operation
, MAX(l.last_update_time-l.start_time)*86400 secs
, COUNT(*) execs
, SUM(totalwork) totalwork
FROM (
SELECT l.*
, SUBSTR(l.message,1,instr(l.message,':',1,1)-1) operation
FROM v$session_longops l) l
GROUP BY l.sid, l.serial#, l.sql_address
, l.sql_hash_value, l.target, l.operation
) l
GROUP BY l.target, l.operation, l.sql_hash_value
) l
LEFT OUTER JOIN v$sql s ON s.hash_value = l.sql_hash_value
--AND s.address = l.sql_address
AND s.child_number = 0
ORDER BY secs desc
/
spool off

This is some sample output. This particular statement has been submitted by the publication servers 25 times with a cumulative execution time of 878 seconds.

TARGET
----------------------------------------------------------------
OPERATION
------------------------------------------------------------------
SQL_HASH_VALUE SECS EXECS
-------------- ---------- ----------
SQL_TEXT
------------------------------------------------------------------
SYSADM.PSAPMSGPUBCON
Table Scan
1297842315 878 25
SELECT :"SYS_B_0", MIN(B.MSGNAME), MIN(A.PUBCONSTATUS), COUNT(*)
FROM PSAPMSGPUBCON A, PSAPMSGPUBHDR B WHERE A.PUBID = B.PUBID AND
A.PUBNODE = B.PUBNODE AND A.CHNLNAME = B.CHNLNAME AND A.CHNLNAME
IN (SELECT S.CHNLNAME FROM PS_AMM_CHNL_SECVW S WHERE S.OPRID =
:"SYS_B_1") AND A.LASTUPDDTTM >= TO_DATE(SUBSTR(:"SYS_B_2",
:"SYS_B_3", :"SYS_B_4"), :"SYS_B_5") GROUP BY B.MSGNAME,
A.PUBCONSTATUS ORDER BY MIN(B.MSGNAME), MIN(A.PUBCONSTATUS)

Friday, September 07, 2007

Running Unix Commands and Scripts from the PeopleSoft Process Scheduler

(Update 26.2.2017) This article has been updated.  See http://blog.psftdba.com/2017/02/process-scheduler-shell-script.html.

Some PeopleSoft systems generate interfaces files that are then delivered to other systems by other shell scripts. These scripts may simply be initiated by the UNIX cron facility. The problem with this is that the scripts run irrespective of whether the PeopleSoft process that generated the interface file ran and completed successfully.

It is possible to use the Process Scheduler to run operating system commands, and to have those command interact appropriately with the generic Process Scheduler functionality.

Process Type Definition

First you need to create a new process type, I chose to call it ‘Shell Script’, that will run a named shell script, psft.sh. This wrapper script performs the interaction with the Process Scheduler and it in turn calls the script that is to be executed. The name of the database, the access ID and password, and the process instance are passed to the wrapper. Other parameters will be appended in the individual Process Definition.

Process Definition

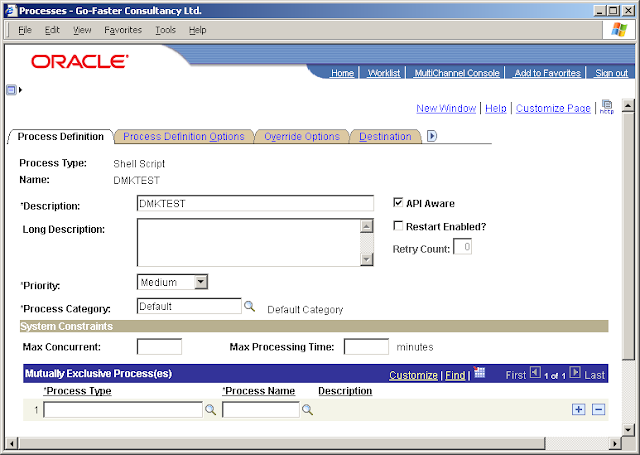
It is necessary to create a Process Definition for each system command or script that is to be executed by the Process Scheduler. You could simply run the command directly from the Process Scheduler but then it could not be API aware, and the status in the Process Monitor will always be success when it script completes. When using the wrapper script, the API Aware check box should be checked.

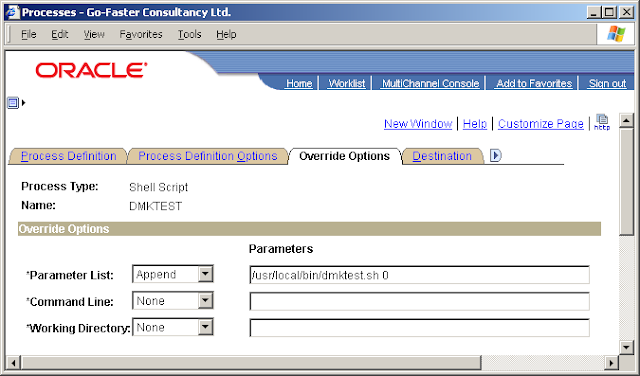
The name of the script of system command and any parameters should be APPENDED to the command line defined in the Process Type definition, as shown below.


Wrapper Script (psft.sh)


This is the wrapper script that is specified in the Process Definition.


#!/bin/ksh
#
# Script:  psft.sh
#
# Syntax:  psft.sh DBNAME ACCESSID ACCESSPSWD PRCSINSTANCE 
# where
# DBNAME is the name of the PeopleSoft datbase with a corresponding TNS entry
# ACCESSID is the schema containing the PeopleSoft database
# ACCESSPSWD is the password to ACCESSID
# PRCSINSTANCE is the process instance number supplied by PeopleSoft
#
# Purpose: To start Standard UNIX Shell Script from Process Scheduler, and interface with the PeopleSoft Process Scheduler
#

if [ $# -lt 4 ]; then
echo "Usage $0:     "
exit 1
fi

CONNECT=$2/$3@$1 
PRCSINSTANCE=$4
shift 4

#
# Function to set status of API aware process instance
#
function prcsapi 
{
if [ $# -lt 2 ]; then
echo "Parameter Error in function $0"
exit 1
fi

TIMESTAMPCOL=${1}
STATUS=${2}

if [ ${PRCSINSTANCE} -gt 0 ];then
echo "Setting process request ${PRCSINSTANCE} to status ${STATUS}"
sqlplus -S /nolog <<!
set termout off echo off feedback off verify off
connect ${CONNECT}
UPDATE  psprcsque
SET  runstatus = ${STATUS}
, sessionidnum = $$ 
,  lastupddttm = SYSDATE
WHERE  prcsinstance = ${PRCSINSTANCE}
;
UPDATE psprcsrqst 
SET  runstatus = ${STATUS}
,  prcsrtncd = ${PRCSRTNCD}
, continuejob = DECODE(${STATUS},2,1,7,1,9,1,0) 
, ${TIMESTAMPCOL} = SYSDATE
,  lastupddttm = SYSDATE
WHERE  prcsinstance = ${PRCSINSTANCE}
;
COMMIT;
exit
!

RET=$?
if [ ! $RET ];then
echo "SQL*Plus Error Return Code: $?"
fi
fi
}

#
# Process files in ${PSPRCSLOGDIR)/*
#

function logfiles 
{
#set -x 
SEQNUM=0
if [ -d "${PSPRCSLOGDIR}" ]; then
for FILELIST in ${PSPRCSLOGDIR}/*
do
if [ "${FILELIST}" != "${PSPRCSLOGFILE}" ];then
SEQNUM=$(expr 1 + ${SEQNUM})

sqlplus -S /nolog <<!
set termout off echo off feedback off verify off
connect ${CONNECT}
INSERT  INTO psprcsrqstfile
( prcsinstance, seqnum, prcsrqstfile)
VALUES (${PRCSINSTANCE}
, ${SEQNUM}
, '${FILELIST}');
COMMIT;
exit
!
RET=$?
if [ ! $RET ];then
echo "SQL*Plus Error Return Code: $?"
fi
fi
done
else
echo "Directory ${PSPRCSLOGDIR} does not exist"
fi

}

#
# Main Execution Starts Here
#

echo $0:$*
date
uname -a
#set
PRCSRTNCD=0
prcsapi begindttm 7 

#Run the command
$*
PRCSRTNCD=$? 

if [ ${PRCSRTNCD} -ne 0 ]; then
prcsapi enddttm 3 # failure
else
prcsapi enddttm 9 # success
fi

date


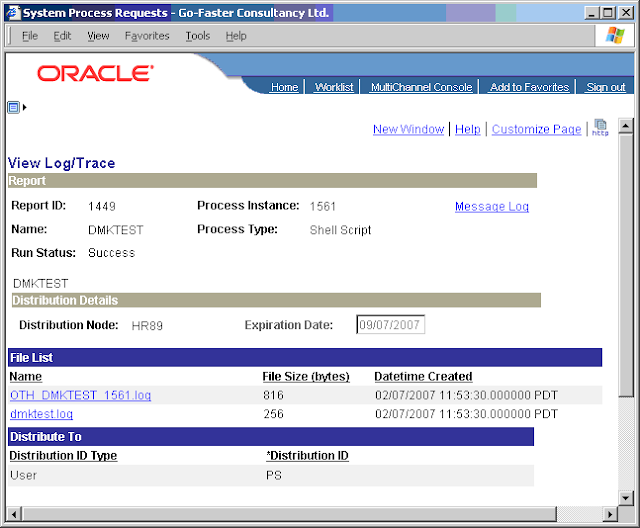
The newly defined Process can be run just as any other process is usually run. Any output from the script on the standard output channel is captured by the Process Scheduler and written to a logfile that can then be viewed from the View Log/Trace facility within Process Monitor.


Two files are shown in the Process Monitor.

OTH_DMKTEST_1561.log is the standard output of the script that was captured by the Process Scheduler.
dmktest.log is a file emitted by the called shell script dmktest.sh to the reporting directory.

Demonstration

This is the test script called by the Process Definition DMKTEST.

banner "HelloWorld" 

BASENAME=$(basename $0 .sh)
if [ -d "${PSPRCSLOGDIR}" ] ; then
echo "This script is running under Process Scheduler"
cp $0 ${PSPRCSLOGDIR}/${BASENAME}.log 
else
echo "This script is not running under Process Scheduler"
fi

exit $*


This is the standard output of the script found in file OTH_DMKTEST_1561.log

/usr/local/bin/psft.sh:/usr/local/bin//dmktest.sh 0
Mon  2 Jul 11:53:15 2007
Setting process request 1561 to status 7
#     #                                 #     #
#     #  ######  #       #        ####  #  #  #   ####   #####   #       #####
#     #  #       #       #       #    # #  #  #  #    #  #    #  #       #    #
#######  #####   #       #       #    # #  #  #  #    #  #    #  #       #    #
#     #  #       #       #       #    # #  #  #  #    #  #####   #       #    #
#     #  #       #       #       #    # #  #  #  #    #  #   #   #       #    #
#     #  ######  ######  ######   ####   ## ##    ####   #    #  ######  #####

This script is running under Process Scheduler
Setting process request 1561 to status 9
Mon  2 Jul 11:53:16 2007


A more detailed version of this document can be found at http://www2.go-faster.co.uk/docs/process_scheduler_shell_scripts.pdf

Please not this blog is not a support site.  Please do not use the comments to ask for support on this script, you can contact me directly.  You will need a basic knowledge of Unix shell scripting to use this technique.

Tuesday, August 28, 2007

Performance Metrics for Scheduled Queries in PeopleSoft

The ability to log executions of ad-hoc Queries executed via the Query Viewer in the PIA was introduced in PeopleTools 8.44. However, not all queries are executed directly, they can also be scheduled via the Process Scheduler. Queries whose result sets are larger than the maximum fetch size for the PSQRYSRV server raise an error, and they must be scheduled.

Don't be tempted to increase the maximum fetch size because the entire result set for queries run in the PIA is set to the Java pool in the web server, and so it can impact all other users of that web server.

Scheduling queries is a good thing because:
i) You no longer copy the results to the web server Java pool.
ii) You can restrict the number of queries that can execute concurrently with standard Process Scheduler functionality.

However, Query logging does apply to scheduled queries, and recently I needed to find a way to work out which scheduled queries were executed most frequently and took the longest time. With most batch processes, it is just a matter of querying the process scheduler request table PSPRCSRQST, but scheduled queries are executed by an Application Engine program called PSQUERY. The query name is specified on a run control, but operators tend to recycle the run controls, so I can't use them. All queries will look the same. However, the name of the query output file includes the name of the query. The list of posted output files is held on the table PS_CDM_FILE_LIST. By joining these two tables, I know how long it took to execute each query, and I can construct the following query for Oracle RDBMS (updated 10.10.2011).

column qryname   format a30     heading 'Query Name'
column avg_secs format 9,999.9 heading 'Average|Exec|(s)'
column sum_secs format 999,990 heading 'Total|Exec|(s)'
column num_execs format 999,990 heading 'Number|of|Execs'
SELECT QRYNAME
, AVG(EXEC_SECS) AVG_SECS
, SUM(EXEC_SECS) SUM_SECS
, COUNT(*) NUM_EXECS
FROM (
SELECT
SUBSTR(F.FILENAME,1,INSTR(FILENAME,'-'||LTRIM(TO_CHAR(F.PRCSINSTANCE))||'.')-1
) QRYNAME
,((ENDDTTM+0)-(BEGINDTTM+0))*86400 EXEC_SECS
FROM PSPRCSRQST P, PS_CDM_FILE_LIST F
WHERE P.PRCSNAME = 'PSQUERY'
AND P.RUNSTATUS = 9
AND P.PRCSINSTANCE = F.PRCSINSTANCE
AND NOT F.CDM_FILE_TYPE IN('LOG','AET','TRC')
)
GROUP BY QRYNAME
ORDER BY SUM_SECS DESC
/


Average Total Number
Exec Exec of
Query Name (s) (s) Execs
------------------------------ -------- -------- --------
PYRL_SEGMENTATION 3,846.6 38,466 10
PYRL_MISC_ELEMENT 3,363.3 20,180 6
PYRL_ELEMENT_MISC 1,674.8 20,097 12
PYRL_NO_DED_RECIP 2,366.3 18,930 8
PYRL_LOAN_BY_PERIOD 2,888.0 5,776 2
PYRL_OPAY_AMT 1,237.0 4,948 4
PYRL_NET 4,893.0 4,893 1
Q_ELEMENT_AMOUNTS 1,083.5 2,167 2
PYRL_NI_EXCEP_LEAVERS 412.0 2,060 5
PYRL_BANK_DETAILS 179.5 1,795 10
...

But there some limitations:
i) Once a query has been purged from the Process Monitor is will no longer be included in the statistics.
ii) This technique cannot distinguish between a public and a private query of the same name. If any operators copy a public query to a private one of the same name, this query will report them all as one.

I have also produced a version of this query for SQL Server:

SELECT
SUBSTRING(F.FILENAME,1,PATINDEX('%-'+LTRIM(STR(F.PRCSINSTANCE))+'.%',FILENAME)-1) QRYNAME
, AVG(DATEDIFF(s,BEGINDTTM,ENDDTTM)) AVG_SECS
, SUM(DATEDIFF(s,BEGINDTTM,ENDDTTM)) SUM_SECS
, COUNT(*) NUM_EXECS
FROM PSPRCSRQST P, PS_CDM_FILE_LIST F
WHERE P.PRCSNAME = 'PSQUERY'
AND P.RUNSTATUS = 9
AND P.PRCSINSTANCE = F.PRCSINSTANCE
AND F.CDM_FILE_TYPE IN('CSV','XLS') --there might be more
GROUP BY SUBSTRING(F.FILENAME,1,PATINDEX('%-'+LTRIM(STR(F.PRCSINSTANCE))+'.%',FILENAME)-1)
ORDER BY SUM_SECS DESC

Thursday, July 26, 2007

Fine-Grained Auditing in PeopleSoft

Recently, somebody asked me whether it is possible to audit the fact that someone has queried a piece of data in PeopleSoft. It led to an interesting piece of research.
It is a fairly easy matter to configure Fine-Grained Auditing (FGA) in Oracle, you have to create a policy with the DBMS_FGA package. You can choose which columns to audit and a logical audit condition to determine whether the rows should be audited. This example will log users who query salary data from the JOB record in PeopleSoft.
BEGIN
sys.dbms_fga.add_policy
(object_schema=>'SYSADM'
,object_name=>'PS_JOB'
,policy_name=>'JOB_SALARY'
,audit_condition=>'ANNUAL_RT != 0 OR MONTHLY_RT != 0 OR DAILY_RT != 0 OR
HOURLY_RT != 0 OR SHIFT_RT != 0 OR SHIFT_FACTOR != 0'
,audit_column=>'ANNUAL_RT, MONTHLY_RT, DAILY_RT, HOURLY_RT, SHIFT_RT,
SHIFT_FACTOR'
,enable=>TRUE
,statement_types=>'SELECT'
,handler_schema=>'SYS'
,handler_module=>'dmk_fga_hand( object_schema, object_name, policy_name)'
,audit_trail=>DBMS_FGA.DB + DBMS_FGA.EXTENDED
,audit_column_opts=>DBMS_FGA.ANY_COLUMNS);
END;
/
If the audit condition is matched for any rows in a query, and the query selects one of the audit columns, a single audit row is produced, irrespective of the number of rows that match.
Be aware that if the audit condition raises an error for any inspected row (such as an error caused by coercion), the audited query will also fail. There will be nothing in the message to suggest that it is caused by FGA, and so it can be difficult to diagnose and debug.
I chose to save the audit data to a table in the database, but alternatively, you can output the audit data as an XML data structure in a flat-file written by setting:
, audit_trail=>DBMS_FGA.XML
Oracle writes a file to the directory indicated by the AUDIT_FILE_DEST parameter.
And this is the data the Oracle records in the table.
SESSIONID DBUID    OSUID              OSHST
--------- -------- ------------------ ----------------------
EXTID                  OBJ$SCHEMA OBJ$NAME   POLICYNAME
---------------------- ---------- ---------- ----------
     SCN LSQLTEXT                             STMT_TYPE
--------- ----------------------------------- ----------
NTIMESTAMP#                INSTANCE# PROCESS#      STATEMENT
------------------------- ---------- ------------ ----------
  ENTRYID LSQLBIND
---------- -----------------------------------
    1927 SYSADM   GO-FASTER-4\David  GO-FASTER\GO-FASTER-4
GO-FASTER-4\David      SYSADM     PS_JOB     JOB_SALARY
 6375305 SELECT EMPLID, EMPL_RCD, EFFDT, T            1
23-JUL-07 15.47.21.429000          0 6856:11944        12104
        2  #1(6):K0G004 #2(1):0
It tells us is that a process, running as OS user David on node GO-FASTER-4, connected to the database as SYSADM and queried some audited data on table PS_JOB. But this node is the application server, and it will look the same for all access to PeopleSoft via the Application Server or any other program.
We need to collect some more information from the session.
If you use database triggers to audit updates in PeopleSoft, they obtain the PeopleSoft operator ID from the client information string that is set by a call to the DBMS_APPLICATION_INFO package at the start of every service in the application server. They extract the operator ID with a function called GET_PS_OPRID (delivered in getpsoprid.sql).
You can’t put a trigger on the audit table (SYS.FGA_LOG$) because it is owned by SYS, but we could use the error handler to call a custom PL/SQL procedure. The handler module is fired every time an audit record is written. It is intended to permit a notification to be sent on audit to the DBA when a policy is breached. But we could use it for a different purpose. The handler runs in the same session as the process that performs the audited action. So I can collect information about the session and write it to another audit table that I have created.
CREATE TABLE sys.dmk_fga
(timestamp# DATE
,object_schema VARCHAR2(30)
,object_name VARCHAR2(128)
,policy_name VARCHAR2(30)
,ntimestamp# TIMESTAMP
,instance# INTEGER
,sessionid INTEGER
,entryid INTEGER
,scn INTEGER
,action VARCHAR2(32)
,module VARCHAR2(48)
,client_info VARCHAR2(64)
);

CREATE OR REPLACE PROCEDURE dmk_fga_hand ( object_schema VARCHAR2, object_name VARCHAR2, policy_name VARCHAR2 ) AS
l_client_info VARCHAR2(64);
l_action varchar2(32);
l_module varchar2(48);
BEGIN
sys.dbms_application_info.read_client_info(l_client_info);
sys.dbms_application_info.read_module(l_module, l_action);
INSERT INTO dmk_fga
(timestamp#, ntimestamp#
, object_schema, object_name, policy_name
, instance#
, sessionid, entryid
, scn, client_info, action, module)
SELECT sysdate, systimestamp
, object_schema, object_name, policy_name
, i.instance_number
, USERENV('SESSIONID'), USERENV('ENTRYID')
, d.current_scn, l_client_info, l_action, l_module
FROM v$database d, v$instance i
WHERE rownum <= 1;  EXCEPTION WHEN OTHERS THEN NULL; END; /  
And this is the information that is inserted into my new logging table
TIMESTAMP#          OBJECT_SCH OBJECT_NAM POLICY_NAM
------------------- ---------- ---------- ----------
NTIMESTAMP#               INSTANCE# SESSIONID ENTRYID
------------------------- --------- --------- -------
     SCN ACTION               MODULE
--------- -------------------- --------------------
CLIENT_INFO
-----------------------------------------------------
23:00:54 23/07/2007 SYSADM     PS_JOB     JOB_SALARY
23-JUL-07 23.00.54.015000         1      1927       6
 6390779                      PSAPPSRV.exe
PS,,go-faster-4.london.go-faster.co.uk,HCM89,PSAPPSRV.exe,
The SCNs do not match between these two audit records. There is a difference of at least 3, but the tables can be joined on SESSIONID and ENTRYID (so you will probably need an index on these columns).
set long 5000
SELECT --b.client_info,
sysadm.get_ps_oprid(b.client_info) oprid,a.ntimestamp#, a.POLICYNAME
,a.lsqltext, a.lsqlbind
FROM  sys.fga_log$ a, sys.dmk_fga b
WHERE a.sessionid = b.sessionid
AND   a.entryid = b.entryid
;
Now, when I open a component in PeopleSoft that queries somebody’s compensation rate, the FGA policy generates a record.

I can use the above query to combine the audit data. It this example it shows that operator PS queried salary data for employee
OPRID        NTIMESTAMP#               POLICYNAME
------------ ------------------------- ----------
LSQLTEXT
----------------------------------------------------
LSQLBIND
----------------------------------------------------
PS           23-JUL-07 22.00.53.968000 JOB_SALARY
SELECT EMPLID, EMPL_RCD, EFFDT, TO_CHAR(EFFDT,'YYYY-
...
PL_RCD, EFFDT DESC, EFFSEQ DESC
#1(6):K0G005 #2(1):0
Note that the data was queried from the database when the component was opened, and that is when the audit occurred. The operator would have to navigate to the ‘Compensation’ tab to see the data, so the audit does not absolutely prove the data was displayed to the operator, but I suspect that is only a semantic difference.

Overhead


The ability to audit is all very well, but it comes at a price. It is not difficult to generate a large number of audit rows. In the following PL/SQL block, an audit row is generated for each time the query inside the loop is executed (2050 times on my HR demo database).
DECLARE
l_annual_rt NUMBER;
BEGIN
FOR i IN (SELECT DISTINCT emplid, empl_rcd FROM ps_job WHERE effdt <= SYSDATE) loop  
 SELECT j.annual_rt  
 INTO l_annual_rt  
 FROM ps_job j  
 WHERE j.emplid = i.emplid  
 AND j.empl_rcd = i.empl_rcd  
 AND j.effdt = (
  SELECT MAX(j1.effdt) FROM ps_job j1
  WHERE j1.emplid = i.emplid
  AND   j1.empl_rcd = i.empl_rcd
  AND   j1.effdt <= SYSDATE)  
 AND j.effseq = (
  SELECT MAX(j2.effseq) FROM ps_job j2
  WHERE j2.emplid = i.emplid
  AND   j2.empl_rcd = i.empl_rcd
  AND   j2.effdt = j.effdt); 
END LOOP;
END;
/ 
This can have a dramatic effect on performance. I ran the above PL/SQL on my laptop with SQL*Trace.
Operation
Without FGA

With FGA

Driving Query
0.46s
0.43s

Inner Query
0.92s
3.43s


Insert into FGA_LOG$

1.68s

Insert into DMK_FGA

6.48s
Other time in Exception Handler

0.72s

Total
1.38s
12.75s
FGA causes a huge increase in the response time of this test. Most of the additional time is spent inserting the audit rows, although the performance of the single disk in my laptop is probably magnifying the effect.
Conclusion
I have demonstrated that it is possible to use FGA to monitor who is looking at what in PeopleSoft as well as detecting other forms of break-in. However, it can introduce a significant run-time overhead. The ability to incorporate a custom PL/SQL notification procedure suggests that it is designed with the intention of logging exceptional activities rather than routine one that users are permitted to perform.

While FGA could be used to audit access to sensitive data, I think that row-level security should be set up correctly in PeopleSoft in the first place, so that only duly authorised users can access sensitive data. I suggest that FGA should only be used conservatively to monitor exceptional events.

Monday, July 02, 2007

Changes to Long Columns and Unicode in PT8.48

Unicode and the use of Long columns in PeopleSoft have been subjects that I have grumbled about in the past. However, Oracle now appear to have addressed them in PeopleTools 8.48. Unfortunately I cannot find any guiding documentation., and I stumbled across these changes by accident. However, if they work, they are both things that customers should know about.

PeopleSoft deliver two scripts in the PT8.48 distribution in %PS_HOME%/scripts: upgradedboptions_enable.sql and upgradedboptions_disable.sql, but I cannot find any documentation.

They set PSSTATUS.DATABASE_OPTIONS to 2 and 0 respectively. This one setting controls both features.

Unicode

I found the following in the platform advisory note: Operating System, RDBMS & Additional Component Patches Required for Installation on PT 8.48 under RDBMS Patches for 10g.

"Note#3: Required INIT.ORA Parameters for building 'Unicode' databases with PT8.48 and Enterprise application releases 9 or later...
Note. If it is your intention to create a Unicode DB for an application release 9 or later database, then the following init.ora parameter is mandatory. The PeopleSoft Unicode implementation for PT8.48 no longer triples the VARCHAR2 datatype columns. Instead we rely on an Oracle feature called CHARACTER LENGTH SEMANTICS. This parameter is not needed for non-unicode DB's or for pre-9 unicode application databases.

NLS_LENGTH_SEMANTICS=CHAR "

However, this advice is not in the same note for PeopleTools 8.49. Tests have shown PeopleTools 8.48 no longer trebles the length of string columns if PSSTATUS.UNICODE_ENABLED = 1 and PSSTATUS.DATABASE_OPTIONS is set to 2 (I haven't tested 8.49 yet, but the installation guide now says that you now 'must' use Character Semantics for Unicode databases).

This change will be a huge improvement for PeopleSoft customers who need Unicode support. The length checking constraints can dramatically increase the overhead of parsing SQL in Oracle (I have seen as much as a 300% increase in parse time - see my Unicode Oddity presentation).

LONG -v- CLOB columns

If PSSTATUS.DATABASE_OPTIONS is set 2, columns that would normally be created as type LONG, are now created as CLOBs.

Use of CLOBs has a number of advantages.
  • It is not possible to partition a table with a LONG, but it is permitted with a CLOB.
  • It permits the use of SQL string functions on CLOBs that cannot be used on LONGs
  • It is possible to move data in CLOBs across database links (or at least the first 32K).
  • In Oracle 9i, it was not possible to use Streams to replicate a table with a long column. This restriction was removed in 10g. However, most PeopleSoft customer upgrading to PeopleTools 8.48 will also take the opportunity to upgrade to Oracle 10g

  • Examples

    The settings in these fields on the table PSSTATUS control the generation by Application Designer and Data Mover of the column list [TBCOLLIST] in the create table DDL model.
    PSSTATUS.
    DATABASE
    _OPTIONS
    PSSTATUS.
    UNICODE
    _ENABLED
    Create Table DDL
    00CREATE TABLE PS_DMK
    (EMPLID VARCHAR2(11) NOT NULL
    ,EMPL_RCD SMALLINT NOT NULL
    ,EFFDT DATE
    ,DESCRLONG LONG VARCHAR) ...
    0 1 CREATE TABLE PS_DMK
    (EMPLID VARCHAR2(33) NOT NULL CHECK(LENGTH(EMPLID)<=11)
    ,EMPL_RCD SMALLINT NOT NULL
    ,EFFDT DATE
    ,DESCRLONG LONG VARCHAR) ...
    2 either 0 or 1 CREATE TABLE PS_DMK
    (EMPLID VARCHAR2(11) NOT NULL
    ,EMPL_RCD SMALLINT NOT NULL
    ,EFFDT DATE
    ,DESCRLONG CLOB) ...

    Wednesday, June 27, 2007

    Data Guard Implications of NOLOGGING operations from PeopleTools 8.48

    Stuff changes. I keep finding more changes in PT8.48.

    From PeopleTools 8.48, PeopleSoft builds all indexes with the NOLOGGING option, and thne it alters them to logged objects. This is done to reduce redo generation during the index build process. It can save time by reducing redo, and can be useful in development environments.

    However, this has implications when running Oracle Data Guard. If an operation is not logged on the primary, it will not be replicated to the standby databases.

    Here is a simple test. We will create a table on the primary database, but the index will be created NOLOGGING, which exactly what PeopleSoft does. I have deliberately set the database to allow NOLOGGING operations

    ALTER DATABASE NO FORCE LOGGING;

    CREATE TABLE t (a number);

    INSERT INTO t
    SELECT rownum FROM dba_objects
    WHERE ROWNUM <= 1000;

    CREATE UNIQUE INDEX t_idx ON t (a) NOLOGGING;

    ALTER INDEX t_idx LOGGING;

    ALTER SYSTEM SWITCH LOGFILE;

    Switching the log file forces the changes to be replicated to the secondary database. Now open the secondary database in read only:

    SELECT /*+ FULL(t)*/ COUNT(a) FROM t;

    COUNT(A)
    ----------
    1000

    So there are 1000 rows in the table, but if I force Oracle to count the rows in the index using a hint I get a corrupt block error:

    SELECT /*+ INDEX_FFS(t t_idx)*/ COUNT(a) FROM t
    *
    ERROR at line 1:
    ORA-01578: ORACLE data block corrupted (file # 1, block # 134419)
    ORA-01110: data file 1: '/u01/oradata/hcm89/system01.dbf'
    ORA-26040: Data block was loaded using the NOLOGGING option

    This could happen every time you build an index using a script generated by the application designer. The status on the corrupt index is still VALID, so you would have no way of knowing whether this problem existed before you open your standby and run on it (because you can't run PeopleSoft on a standby database in read only mode).

    So how can you prevent this from happening in the first place?

    You could alter the DDL models to remove the NOLOGGING option from the CREATE INDEX DDL model. But the same argument applies to any NOLOGGING operation performed in the database. You are likely to get corrupt objects in your standby database. Although, I know of no other NOLOGGING operations in a vanilla PeopleSoft database, if any are introduced during development then DBAs are unlikely to be able to change them.

    It was for exactly this reason that Oracle provided the ability to force NOLOGGING operations to generate redo information. It is set with the following command:

    ALTER DATABASE FORCE LOGGING;

    Now the database will log all operations regardless and all objects and operations will be fully replicated to the standby database. However, nothing is free. NOLOGGING is often used to improve performance by reducing redo, for example when populating working storage tables which will never need to be recovered. These performance improvements will be lost when logging is forced.

    Database Login Information In Your Sqlplus Prompt

    Have you ever run the wrong script in SQL*Plus in the wrong database?

    It is common to have many databases in PeopleSoft development environments, and developers must often connect to different databases. To help reduce the chance of accidentally working in the wrong environment I have my login script on SQL*Plus that puts information about my session in the command prompt. When you connect to a database SQL*Plus automatically runs %ORACLE_HOME%/sqlplus/admin/glogin.sql. I have put my own login script gfclogin.sql into the same directory. It is called from glogin.sql like this:

    @@gfclogin.sql

    The double @ means that the called script is in the same directory as the calling script. gfclogin.sql runs a number of SQL queries and stores the output in the SQLPROMPT. Note that from SQL*Plus version 10, the login script is run on every connections, previously it was only run for the initial connection. This has one negative side effect. It will overwrite and SQL statement in the SQL*Plus command buffer when you reconnect (from SQL*Plus 10)

    The some of the queries in the script only work if the connecting user has SELECT_CATALOG_ROLE (or individual privilege to query v$session, v$process, v$database. If the user doesn't have these privileges the prompt will just contain the user name

    SCOTT>

    On a PeopleSoft database it will also report the name of the PeopleSoft database from PS.PSDBOWNER, thus:

    SYSADM-HCM89>

    If the user has SELECT_CATALOG_ROLE it will also show the session ID, session serial number, database name, name of OS user running the database, and the node name of the database server.

    SCOTT.147:4264.GOFASTER.SYSTEM.GO-FASTER-4>

    or

    SYSADM-HCM89.148:5420.HCM89.SYSTEM.GO-FASTER-4>

    Friday, June 15, 2007

    Unix Process Limits for PeopleSoft

    I have been having some trouble with long running Component Interfaces/Application Engine processes. The amount of memory allocated to the process continues to grow throughout the life of the process, and eventually the process hits the limit imposed by Unix. This leads to two modes of error.

    You will get an error message like this in the Application Engine log file.

    SQL error. Stmt #: Error Position: Return: 8007 - Insufficient memory available

    The process might continue to run, or it might fail (I am not sure what makes the difference here), but if it terminates you get will get a message like this also in the Application Engine log.

    <Unix PID>: 1181303384: PSPAL::Abort: Unrecoverable signal received
    <Unix PID>: 1181303384: PSPAL::Abort: Location: /vob/peopletools/src/pspal/exception_sigaction.cpp:553: PSPAL::SigactionSignalHandler::UnrecoverableSignalHandler(int, siginfo_t *, void *)
    <Unix PID>: 1181303384: PSPAL::Abort: Generating process state report to <PS HOME>appserv/prcs/<Process Scheduler Name>/LOGS/psae.<Unix PID>/process_state.txt
    <Unix PID>: 1181303384: PSPAL::Abort: Recursive call to Abort detected. Terminating process now.

    A core file is also produced.

    Application Engine seems to continue to allocate memory but not relinquish it again. I have found support notes on Customer Connection that recommend use of the CollectGarbage() function in PeopleCode in order to 'remove any unreachable application objects created by Application Classes'. However, my tests suggest that this function does not cause any memory to be released by the process.

    Another suggestion from Customer Connection was to raise the Unix system limit for the soft data segment with ulimit -d. This has resolved the memory errors. The command ulimit -d can be user to set soft limits in the Unix shell. However, they cannot be set higher than hard limits. Hence it is necessary to set unlimited parameters in /etc/security/limits (this file can only be read or updated by the superuser: root).

    It is common to disable the limits for Oracle, as shown in the example below. I think the same should be done for PeopleSoft accounts. Machine-wide parameter settings the set in the default section. Individual parameters can then be overridden for individual users. The following example is taken from AIX 5.3. The sizes are multiples of 512 byte blocks. A value of -1 means that the parameter is unlimited.

    default:
    fsize = 2097151
    core = 2097151
    cpu = -1
    data = 262144
    rss = 65536
    stack = 65536
    nofiles = 4000
    root:
    fsize = -1
    data = 4194303
    rss = 4194303
    nofiles = 4000

    oracle:
    fsize = -1
    data = -1
    stack = -1

    psoftusr:
    data = -1

    Changes to the limits take effect when the user next logs onto Unix. After changing the limits you need to log out and back into your Unix account and restart the process scheduler

    Wednesday, May 30, 2007

    PeopleTools 8.48 Process Scheduler Behaviour

    Things change, and I recently got caught out by one of those changes.

    In PeopleTools 8.4x, the Process Scheduler became a proper Tuxedo domain. By default, it is configured to run Application Engine server processes (PSAESRV). These are persistent Tuxedo server processes that handle Application Engine requests. This change was introduced to help CRM systems that typically run a very large number of Application Engine programs. Because the server process is persistent it saves the overhead of starting a new Application Engine process. An obvious side effect of this change in architecture is that if you shut the Process Scheduler down, it terminates the PSAESRV processes, and cancels any Application Engine program that is running.

    You can choose to configure the Process Scheduler without PSAESRV processes, and it will start individual PSAE processes for each Application Engine request.

    In previous versions of PeopleTools, it was possible to shut the Process Scheduler down and any running processes (except PSAESRVs) would continue to run. This is not the case in PeopleTools 8.48. On shutdown, the Process Scheduler attempts to cancel the PSAE process. If it is not successful the status of the process goes to Error, but the process continues to run.

    PSPRCSRV.7150 (0) [...](3)    Server: PSUNX checking status...
    PSPRCSRV.7150 (0) [...](3) Server action mode: Ok (looking for requests)
    PSPRCSRV.7150 (0) [...](3) Server: PSUNX looking for work
    PSPRCSRV.7150 (0) [...](3) Checking Process cancels...
    PSPRCSRV.7150 (0) [...](3) Process 69 is still running as Session ID 7552
    PSPRCSRV.7150 (0) [...](3) Application Engine : 1:3
    PSPRCSRV.7150 (0) [...](0) Server is shutting down


    So, the Process Scheduler knows that process 69 is still running but continues to shutdown

    PSPRCSRV.1360 (0) [...](1) =================================Error===============================
    PSPRCSRV.1360 (0) [...](1) Process 69 is marked 'Initiated' or 'Processing' but can not detect status of PID
    PSPRCSRV.1360 (0) [...](3) Updating process instance's status to Error.
    PSPRCSRV.1360 (0) [...](2) Process Name: PSQUERY
    PSPRCSRV.1360 (0) [...](2) Process Type: Application Engine
    PSPRCSRV.1360 (0) [...](2) Session Id: 7552
    PSPRCSRV.1360 (0) [...](2) =====================================================================
    PSPRCSRV.1360 (0) [...](3) Number of requests removed from Task Active List: 1
    PSPRCSRV.1360 (0) [...](3) Server action mode: Initializing


    But when it starts up again it cannot detect the PID of the process, and so it marks the status as 3 (Error).

    I'm not sure exactly when this change was introduced, but this is the first time I have encountered it.

    Tuesday, May 08, 2007

    Column default values in PeopleTools 8.48 DDL

    PeopleSoft’s Mobile Synchronization Framework is designed to support off-line access to a subset of the PeopleSoft application. Application Designer has been able to generate database triggers to maintain Timestamp and System ID fields on tables that support synchronization of mobile clients since PeopleTools 8.44. In 8.48 it is now possible to set column defaults on character and numeric fields via Application Designer. However, this has potential for much wider application in PeopleSoft applications.

    There are two new checkboxes on the record properties dialogue box.


    If the User -> Server box is checked, Application Designer will add column defaults to the fields in the generated create and alter table DDL. As an example, I created the following record in Application Designer.


    And this was the DDL that Application Designer generated.

    CREATE TABLE PS_DMK (
    EMPLID VARCHAR2(11) DEFAULT ' ' NOT NULL,
    EFFDT DATE,
    SEX VARCHAR2(1) DEFAULT 'U' NOT NULL,
    ACTION_DT DATE NOT NULL,
    ARRIVAL_TIME DATE NOT NULL,
    ACTION_DTTM DATE,
    AA_PLAN_YR SMALLINT DEFAULT 42 NOT NULL,
    ACCRUED_AMOUNT DECIMAL(15, 2) DEFAULT 0 NOT NULL)


    • All of the numeric and character columns now have default values, but none of the date columns have defaults.
    • If a literal value is specified in Application Designer it is carried forward to the DDL, otherwise a character field defaults to a single space and a numeric field to zero
    • Whether a field is required or not does not affect the default value,
    It is a pity that the system variables to specify current date or time do not get converted to SYSDATE in the DDL, thus


    ACTION_DT DATE DEFAULT TRUNC(SYSDATE) NOT NULL,
    ARRIVAL_TIME DATE DEFAULT SYSDATE NOT NULL,


    I assume that this is because it is platform specific, but then so is the rest of the field list.

    There is another problem to using the Up Sync check box. When checked, you are prevented you from making a field required. The unchecked box is greyed out, but fields that are already required remain so.

    I think that the ability to specify column defaults could have advantages during batch processing. All numeric and character columns in PeopleSoft (with minor exceptions) are NOT NULL in the database. Thus, if a process is inserting a row into that table, it must provide a value for every mandatory column. Otherwise, you generate an Oracle error.

    ORA-01400: cannot insert NULL into ("SYSADM"."table name"."field name")

    Specifying a default value will prevent this error. It would also save developers from having to add this default values to their code, thus simplifying development and maintenance.

    Many batch processes in PeopleSoft process working storage or reporting tables. Often they insert rows, filling in key and some other columns, and then update other columns later on. If these columns have defaults they do not need to be referenced in the insert statement.

    When a new column is added to a table, it is necessary to find every place where a row is inserted, and add a value. Specifying a column default would save adding a space or zero to those inserts.